
Figures & data
Figure 1: Schematic Overview of the Obesity Component of the Microsimulation Model
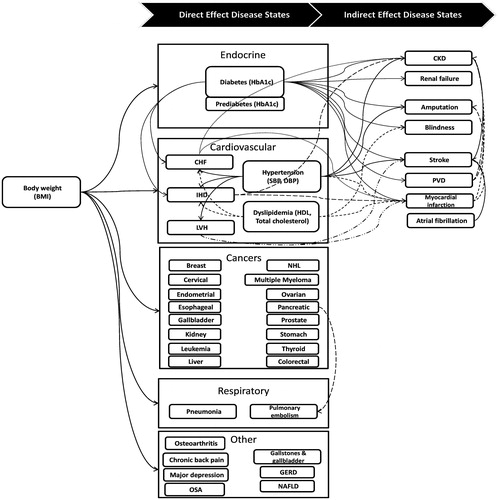
Figure 2: BMI's four routes of influence on IHD
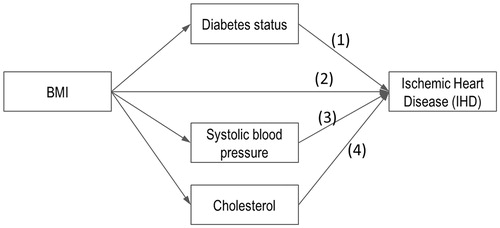
Figure 3. Subpopulations Analyzed
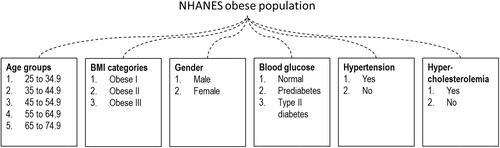
Figure 4. Per capita savings in direct medical cost from different subpopulations
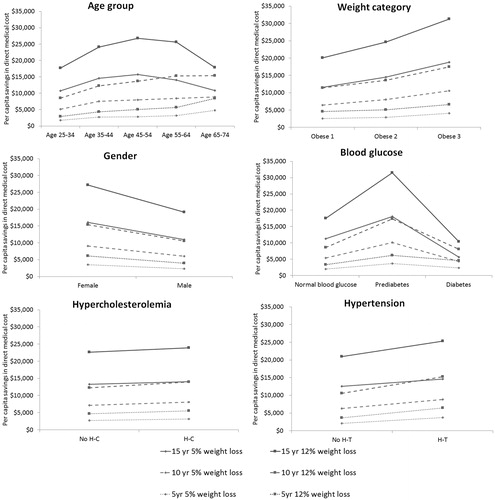
Table 1. Multivariate analysis on per capita medical savings.
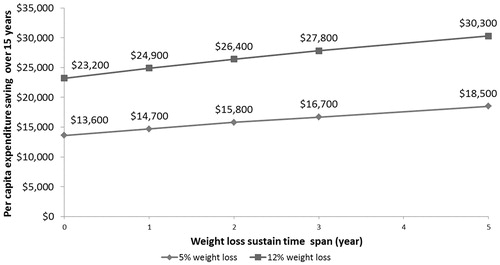
Figure 5. Length of sustained weight loss on per capita medical savings over 15 years
Supplemental material