Figures & data
Figure 1. Transition state Markov model. All patients with RRcHL enter the model in the progression-free state. Patients are initiated on pembrolizumab or BV. In each model cycle, patients can remain progression-free, transition to progressed disease, or die. Patients with progressed disease can only transition to the death state.
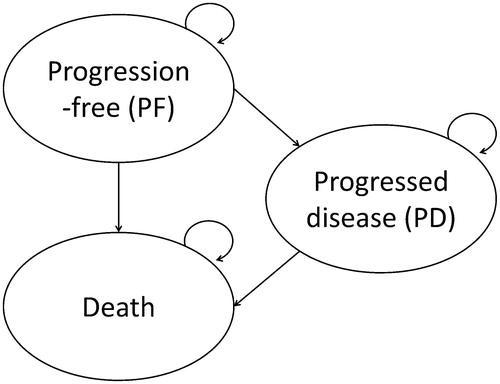
Figure 2. Progression-free survival parametric extrapolations. KM, Kaplan-Meier.
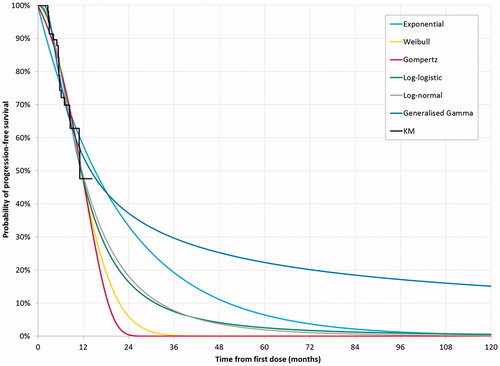
Figure 3. Deterministic sensitivity analysis results. (a) Incremental costs of pembrolizumab vs BV; (b) Incremental QALYs of pembrolizumab vs BV.
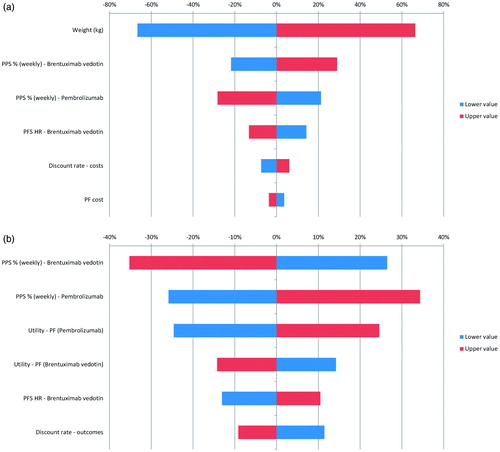
Table 1. Summary of model inputs.
Table 2. Summary of model utility inputs.
Table 3. Scenario analysis of incremental costs and QALYs for pembrolizumab vs BV.
Table 4. Costs and outcomes for treatment with pembrolizumab or BV.
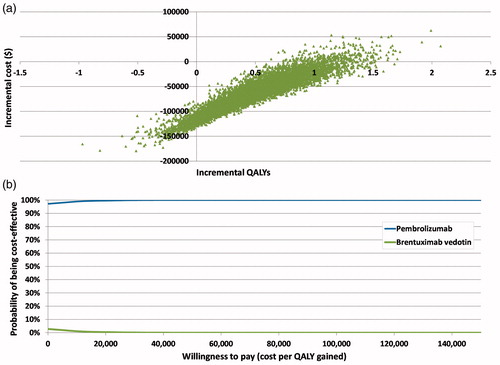
Figure 4. Probabilistic sensitivity analysis (10,000 iterations). (a) Cost-effectiveness plane of pembrolizumab vs BV; (b) Cost-effectiveness acceptability curve of pembrolizumab vs BV.