
Figures & data
Figure 1. A hypothetical example of AD treatment refilling course illustrating measurements of compliance (MPR, Medication Possession Ratio) and persistence (time to non-persistence).
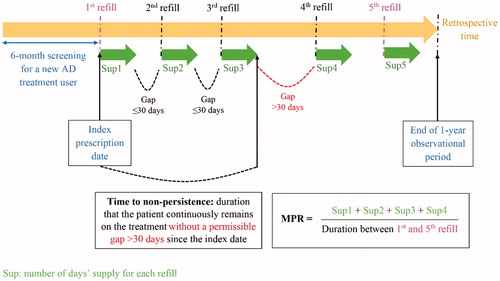
Figure 2. Identification of eligible study subjects from five hospitals’ databases in Thailand for compliance and persistence analyses.
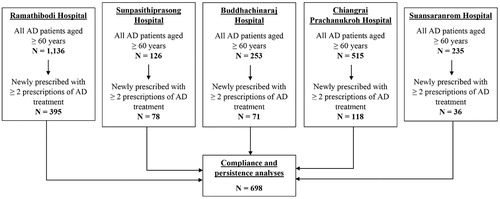
Table 1. Distribution of study subject’s characteristics.
Figure 3. A survival curve illustrating persistence probabilities with AD treatment over a 1-year observational period.
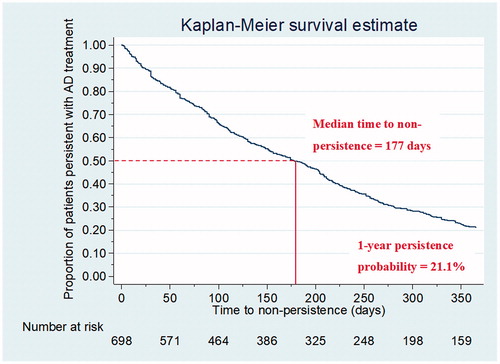
Table 2. Bivariate analyses exploring associations between patient characteristics and compliance with AD treatment.
Table 3. Multivariate analyses of the patient characteristics selected from the bivariate analyses to investigate determinants of non-compliance and non-persistence.
Table 4. Bivariate analyses exploring associations between patient characteristics and persistence probabilities with AD treatment.
Table 5. Sensitivity analyses.