
Figures & data
Table 1. FFS (K = A, J = 1).
Table 2. Sample of physicians and numbers of collected questionnaires.
Table 3. Quantity of medical services provided by physicians under different payment systems.
Table 4. Influences of FFS and CAP on physicians’ provision of medical services for patients with the same level of health.
Figure 1 Relationship between the average quantity of medical services and the optimal quantity of medical services under FFS.
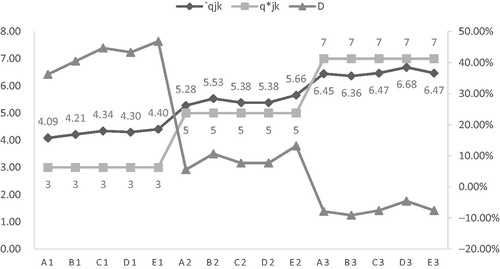
Figure 2 Relationship between average quantity and optimal quantity of medical services under CAP.
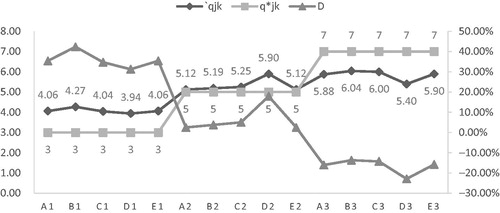
Figure 3 Relationship between average and optimal quantity of medical services under DRGs.
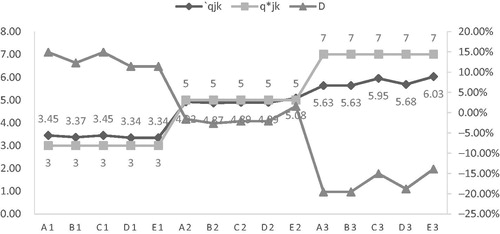
Figure 4 Loss of health benefits to patients with the same level of health.
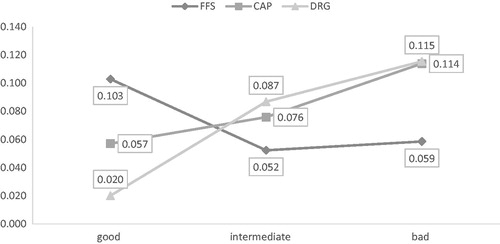
Table 5. Impacts of patient health status on loss of health benefits under the same payment system.
Table 6. Quantity of medical services provided by physicians for patients with different illnesses and with the same health status.