Figures & data
Figure 1. Schematic representation of the Markov model. EDSS, expanded disability status scale; RRMS, relapsing remitting multiple sclerosis; SPMS, secondary progressive multiple sclerosis.
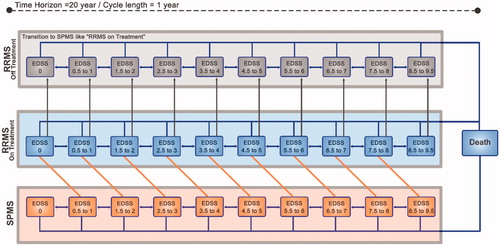
Table 1. Annual transition probability of moving between EDSS states for patients with RRMS or SPMS (age ≥28 years).
Table 2. The result of network meta-analysis estimating ALM and NTZ effectiveness vs placebo.
Table 3. Specific health-state utility weights.
Table 4. Summary of base case cost input parameters.
Table 5. Calculated risk of NTZ-related PML according to risk factors.
Figure 2. ALM and NTZ cumulative costs and effectiveness (NHS perspective). ALM, alemtuzumab; NTZ, natalizumab; NHS, national health system; QALYs, quality adjusted life years.
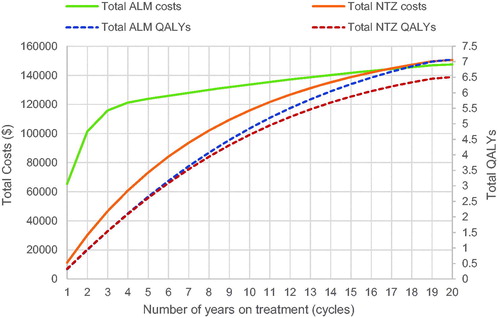
Table 6. Base-case results and sensitivity analyses of the effect of key input parameters on ICER.
Figure 3. Results for one-way sensitivity analysis. (a) Effect of parameter variation on the incremental cost per QALY in the NHS perspective. (b) Effect of parameter variation on the incremental cost per QALY in the societal perspective. ALM, alemtuzumab; NTZ, natalizumab; NHS, national health system; QALYs, quality adjusted life years.
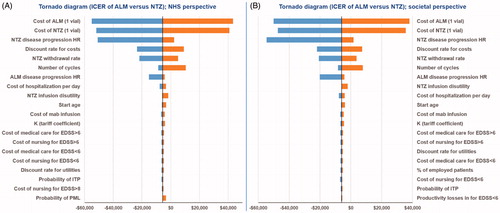
Figure 4. Incremental cost-effectiveness scatter plot for ALM vs NTZ with a willingness-to-pay line at 1 and 3 GDP/capita.
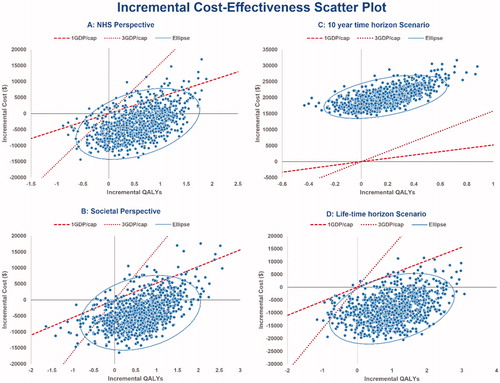
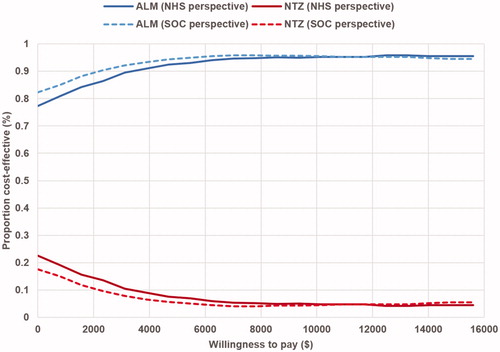
Figure 5. Cost-effectiveness acceptability curve for ALM vs NTZ.