
Figures & data
Figure 1. Patient selection (inclusion/exclusion criteria). LB, liposomal bupivacaine; TKA, total knee arthroplasty. *Patients not insured through Medicare or commercial insurance were not included in the analyses because of the small sample size.
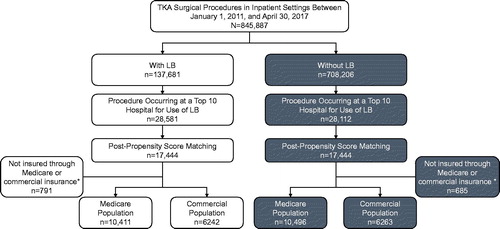
Table 1. Patient demographics and clinical characteristics.Table Footnotea
Table 2. Univariate analysis of mean LOS in the Medicare and commercial populations and LOS by hospital.
Table 3. Multivariable analysis of hospital LOS.
Figure 2. Univariate analyses of discharge location in the (a) Medicare and (b) commercial populations. In the Medicare population, 33 (0.3%) patients treated with LB and 54 (0.5%) treated without LB were discharged to locations other than home, an SNF, or a rehabilitation center; four patients in the LB group and 14 (0.1%) in the group without LB died. In the commercial population, four (0.1%) and 101 (1.6%) patients treated with and without LB, respectively, were discharged to other locations, and one and two patients, respectively, died. LB, liposomal bupivacaine; SNF, skilled nursing facility. p-value from analysis of variance for main effect of discharge status.
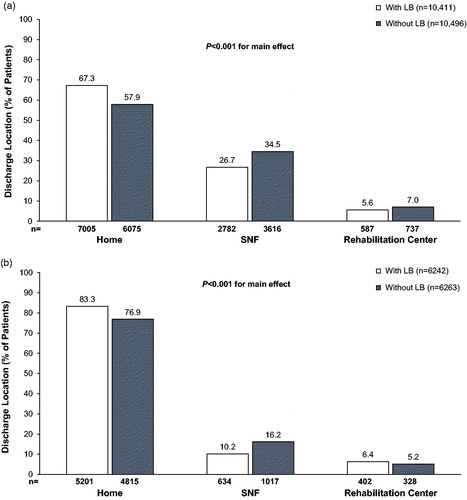
Table 4. Multivariable analysis of discharge to home status.
Table 5. Patients with same-hospital readmissions within 30/60/90 days.
Figure 3. Univariate analyses of total hospital costs in the Medicare and commercial populations. LB, liposomal bupivacaine.
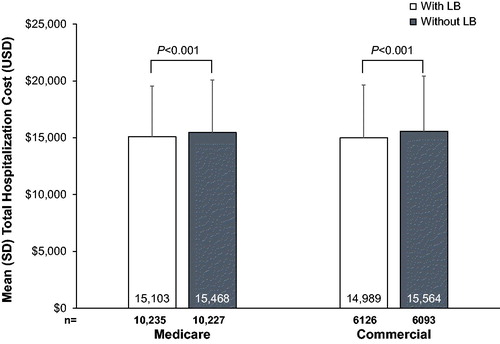
Table 6. Multivariable analysis of total hospitalization costs.
Figure 4. Univariate analyses of total opioid consumption in the Medicare and commercial populations. LB, liposomal bupivacaine; MED, morphine equivalent dose.
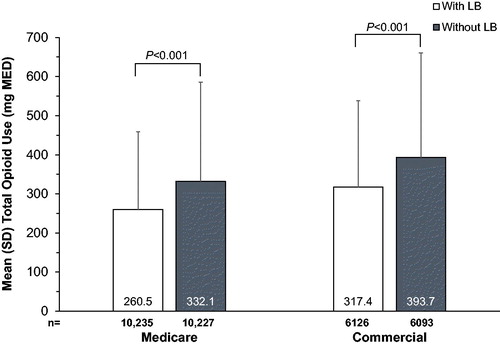
Table 7. Multivariable analysis of opioid consumption.