Figures & data
Figure 1. Markov model. Markov process with cycle length of 3 months and 18 defined states (10 EDSS stages; 4 treatment lines; relapse; discontinuation of treatment, followed by treatment switch or no-treatment; adverse events; and death).
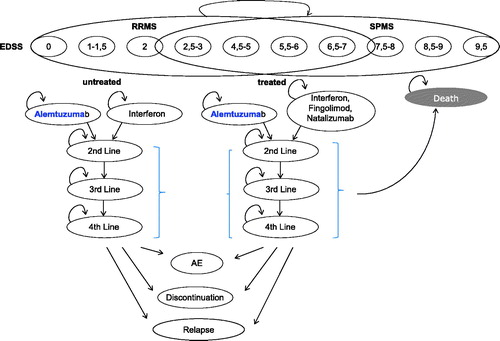
Table 1. Clinical input data.
Table 2. Model inputs: costs.
Table 3. Model inputs: utilities.
Table 4. Cost-effectiveness results.
Figure 2. Deterministic sensitivity analysis was used to identify the critical variables. Results are displayed as Tornado diagrams, where each bar represents a one-way sensitivity analysis, and width of bars represents impact on model results. The ICER per patient is plotted on the x-axis.
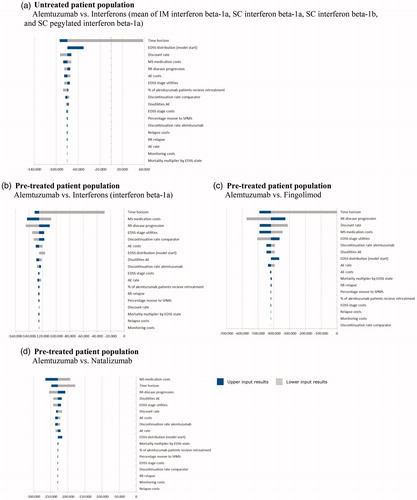
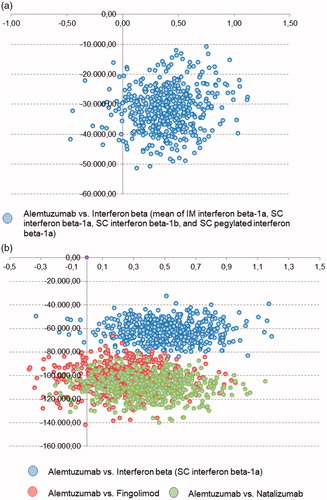
Figure 3. Probabilistic sensitivity analysis: the scatterplot shows results of the Monte Carlo probabilistic sensitivity analysis for 500 patients. Incremental costs are plotted on the y-axis, incremental effectiveness is plotted on the x-axis. The location of majority of points in the lower right quadrant shows that the simulations yields cost savings and improved health outcomes. Alemtuzumab dominates comparators. The base case results attest to the model’s low level of uncertainty. (a) Untreated patient population; (b) pre-treated patient population.