Figures & data
Figure 1. Progression-of-disease tree for patients with VTE. The health states for both branches of rivaroxaban and VKA therapy are identical. Abbreviations. DVT, deep vein thromboembolism; ICH, intracranial haemorrhage; NMCRB, non-major clinically relevant bleeding; PE, pulmonary embolism; PTS, post-thrombotic syndrome; VTE, venous thromboembolism.
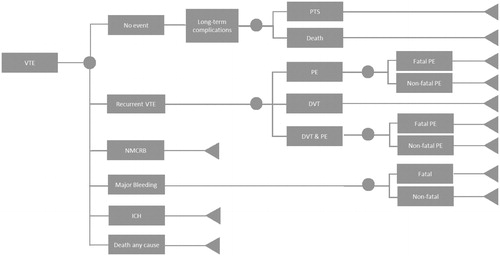
Figure 2. Progression-of-disease tree for patients with non-valvular atrial fibrillation. The health states for both branches of rivaroxaban and VKA therapy are identical. Abbreviation. AF, atrial fibrillation.
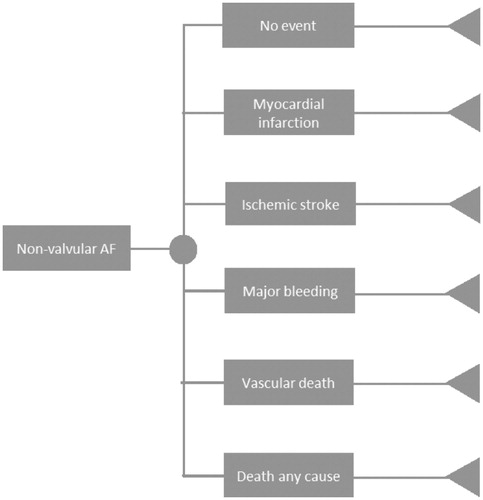
Table 1. Event costs used in cost-effectiveness analysis.
Table 2. Resource utilization and costs of NVAF and VTE.
Table 3. Utilities and disutilities used in the cost-effectiveness analysis.
Table 4. Different populations taken into consideration for the cost-effectiveness analysis of rivaroxaban vs VKA.
Table 5. Deterministic costs, effects (2,000 simulations), and incremental cost effectiveness ratios per patient of the five selected populations.
Figure 3. Probabilistic sensitivity analysis of the base-case scenario. Abbreviation. QALY, quality-adjusted life-years.
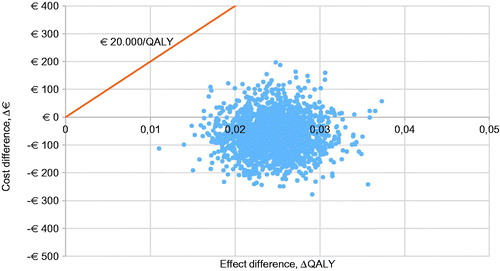
Figure 4. Cost-effectiveness acceptability curve of the base-case scenario (VTE + NVAF patients) and scenarios A, B, C, and D. Abbreviations. CE, cost-effectiveness; NVAF, non-valvular atrial fibrillation; QALY, quality-adjusted life-years; VTE, venous thromboembolism.
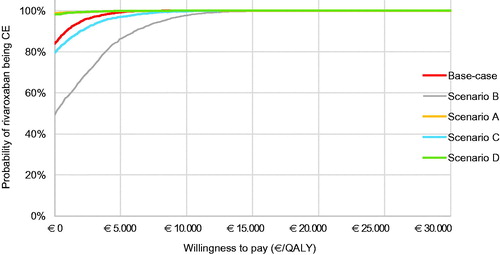
Table 6. Results of the one-way sensitivity analysis for the base-case scenario.
Table A1. XALIA treatment-emergent clinical outcome results with propensity score adjustment.
Table A2. Transition probabilities used in the VTE model.
TABLE A3. Transition probabilities used in the NVAF model.
Table A4. Results of the one-way sensitivity analysis for scenario A.
Table A5. Results of the one-way sensitivity analysis for scenario B.
Figure A1. Probabilistic sensitivity analysis of population A, venous thromboembolism. Abbreviations. CE, cost-effectiveness; QALY, quality adjusted life-year.
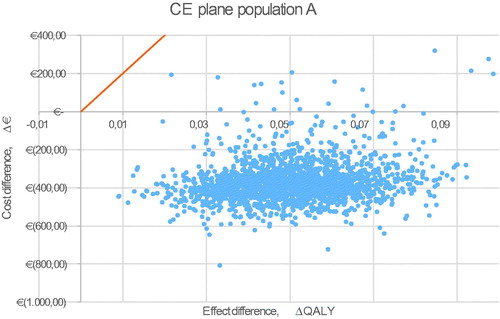
Figure A2. Probabilistic sensitivity analysis of scenario B, non-valvular atrial fibrillation. Abbreviations. CE, cost-effectiveness; QALY, quality adjusted life-year.
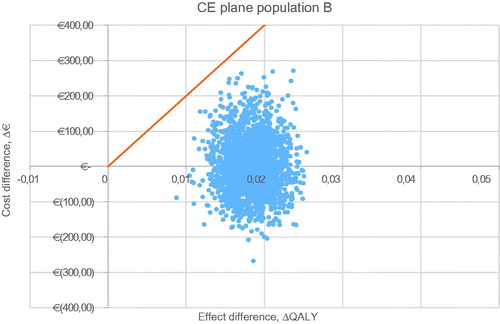
Figure A3. Probabilistic sensitivity analysis of population C, NVAF without stable INR group (TTR < 60%). Abbreviations. CE, cost-effectiveness; QALY, quality adjusted life-year.
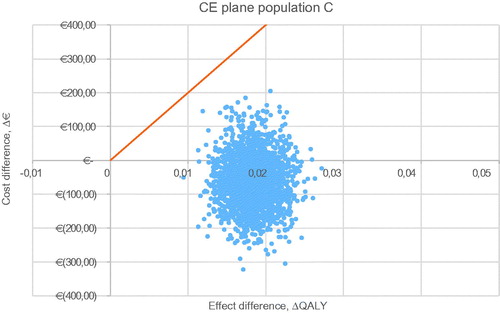
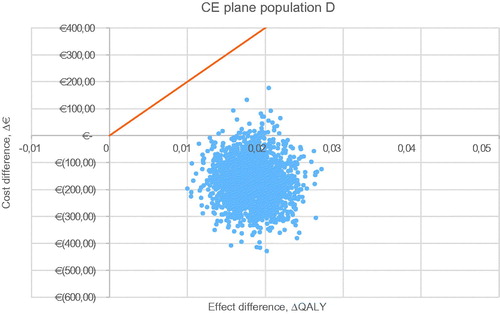
Figure A4. Probabilistic sensitivity analysis of population D, NVAF only self-measures and self-managers. Abbreviations. CE, cost-effectiveness; QALY, quality adjusted life-year.