
Figures & data
Figure 1. Flow diagram depicting selection criteria for HRS study. A total of 2,542 patients meeting all inclusion criteria were identified from 6,118 with an ICD-9 code for HRS in the Cerner HealthFacts database.
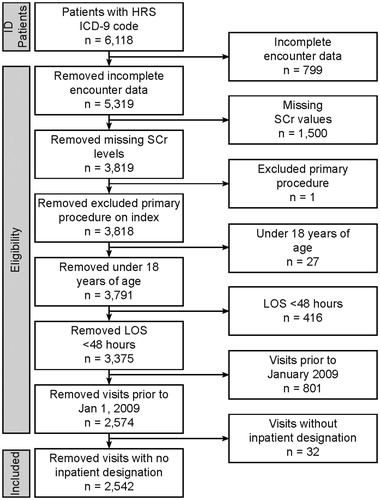
Table 1. Patient demographics.
Figure 2. Charges associated with patient mortality discharge status and payer type. (A) Charges for hospitalization by mortality during index visit. About one third (36.9%) of patients with HRS die during the index hospitalization, associated with greater average and median charges. (B) Charges associated with discharge destination. The line bifurcating the gray boxes indicates median charge, while the upper and lower limits of the box indicate 75% and 25% median charges, respectively. Mean charges are indicated by an X, while the upper and lower limits (lines) indicate 75% and 25% of mean charges, respectively. Although only 12% of patients were transferred to a skilled nursing facility, this was associated with the highest average and median charges, followed by death. (C) Charges associated with payer type. Thirty percent of patients with HRS are covered by Medicare, and account for the second least average and median charges after “other”. Patients who self-pay for their insurance had the highest average charges, whereas those covered by Medicaid had the highest median charges.
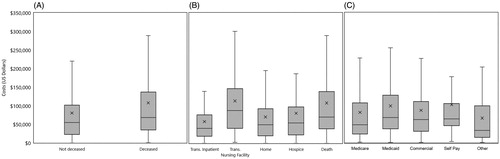
Table 2. Patient visit and hospital characteristics.
Table 3. Pre-existing conditions, precipitants, and etiology.
Table 4. Short-term mortality indicators.
Figure 3. Charges associated with KDIGO-AKI stage and improvement of renal function and readmission type. The line bifurcating the gray box indicates median charge, while the upper and lower limits of the gray boxes indicate 75% and 25% median charges, respectively. Mean charges are indicated by an X, while the upper and lower limits (lines) indicate 75% and 25% of mean charges, respectively. (A) Charges associated with various stages of kidney injury with higher average and median charges increasing through Stage 2 followed by a drop in both mean and median charges in Stage 3. No AKI is associated with the lowest average and median charges. (B) Charges associated with improvement of renal function. Subjects with no change in renal function had the lowest median charge, while those with an improving 30–50% showed the lowest average charge. The highest average and median charge is associated with patients improving > 50%. (C) Charges associated with readmission type.
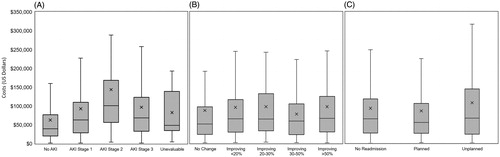
Table 5. Clinical outcomes of HRS patients.
Table 6. Administrative outcomes.
Supplemental Material Tables 1-6
Download MS Word (52.4 KB)Data availability statement
The minimal data set underlying the findings in our study data is reported within this manuscript. Data is available from Cerner Corp (www.cerner.com).