
Figures & data
Figure 1. Overview of model steps and patient flow. All care pathways have the same basic flow through the model: patients enter ED; after registration, patients enter (1) waiting room, then (2) triage before being provided (3) an ED bed. Patients are then either discharged from ED to home, or to (4) observation or (5) are admitted to hospital; patients who go to (4) observation are either discharged home or (5) admitted to hospital; as patients flow through, the ED is modeled according to patient acuity; more severe patients follow an abbreviated path. Abbreviations. BCU, Biocontainment unit; DAL, Dalbavancin; ED, Emergency department; ORI, Oritavancin; VAN, Vancomycin. *Patients treated with DAL/ORI discharged home from ED. †Patients treated with VAN may go to observationCitation11 and then are either discharged home or admitted to hospital.
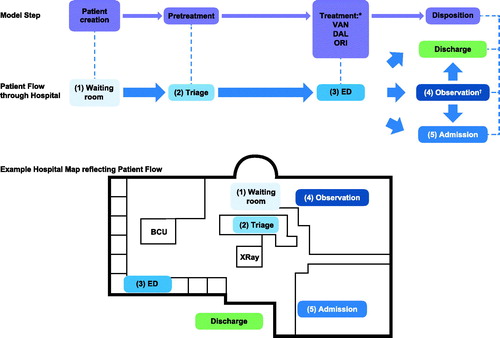
Table 1. Model patient and resource inputs.
Table 2. Model inputs: cost of ABSSSI treatment.
Table 3. ED and observation unit setting metrics.
Figure 2. One-way sensitivity analysis results: tornado diagrams of (A) patient presentation rate, (B) ABSSSI patient presentation rate, (C) acute patient presentation rate, (D) ED nurse count, (E) physician count and (F) ED bed count. To allow extreme values generated by the sensitivity analysis to be plotted on the same tornado diagram, results were normalized by the average result for the base scenario (which was set to 1). Abbreviations. ABSSSI, Acute bacterial skin and skin structure infection; ED, Emergency department; LOS, Length of stay; LWBS, Left without being seen.
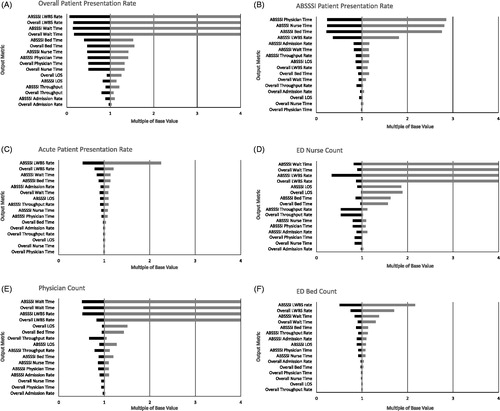
Table 4. Key ED outcomes and cost of treatment for ABSSSI patients.
Supplementary Material
Download PDF (204.8 KB)Data availability statement
The data that support the findings of this study are available from the corresponding author, Katelyn R. Keyloun, upon request.