
Figures & data
Figure 1. Mean active HCP time per patient per administration by tasks. Abbreviation. Diff, difference.
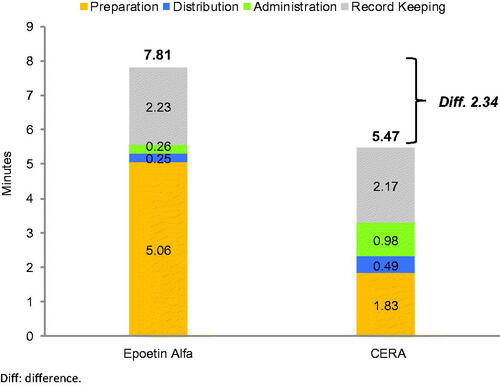
Table 1. Mean active healthcare professional time (HCP) per patient per session.
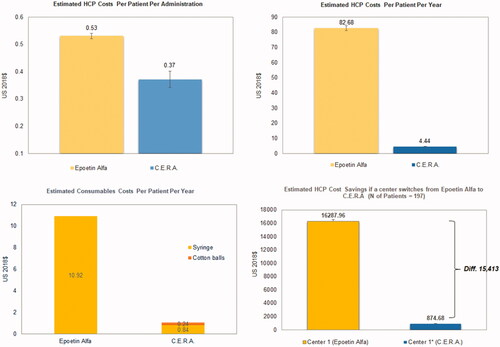
Figure 2. Estimated HCP costs per patient per administration (a), HCP costs per patient per year (b), estimated consumables costs during erythropoietin-stimulating agent administration per patient per year (c), and estimated HCP cost savings if a center switches from Epoetin Alfa to CERA for 1 year (US Dollars year 2018).
Supplemental material