
Figures & data
Table 1. Baseline demographics and clinical characteristics of the stroke/no stroke and major bleeding/no major bleeding matched cohorts.
Figure 1. All-cause healthcare cost comparison PPPY over the entire follow-up period—patients with non-valvular atrial fibrillation using NOACs.
aStatistical differences between cohorts (95% CI) were obtained using non-parametric bootstrap procedure methods with 999 replications. Abbreviations. NOAC, non-vitamin K antagonist oral anticoagulant; PPPY, per patient per year; SE, systemic embolism; CI, confidence interval.
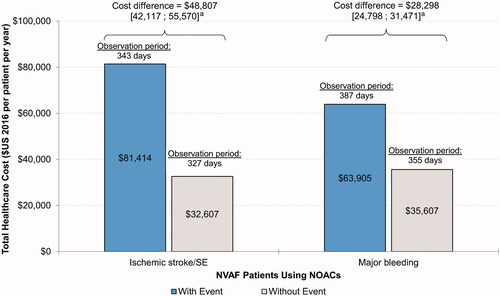
Table 2. All-cause healthcare costs—matched ischemic stroke/systemic embolism cohorts and matched major bleeding cohorts.
Table 3. Long-term all-cause healthcare costs by stroke/systemic embolism events and major bleeding events.
Table 4. All-cause healthcare resource utilization—matched ischemic stroke/systemic embolism cohorts and matched major bleeding cohorts.
Appendix 3
Download MS Word (13.4 KB)Appendix 2
Download MS Word (45.5 KB)Appendix 1
Download MS Word (21 KB)Data availability statement
The data that support the findings of this study are available from Optum (a division of UnitedHealth Group), but restrictions apply to the availability of these data, which were used under license for the current study, and so are not publicly available. Any researchers interested in obtaining the data used in this study can access the database through Optum, under a license agreement, including the payment of an appropriate license fee.