
Figures & data
Figure 1. Hospitalized population stratified by type of acute medical illness.
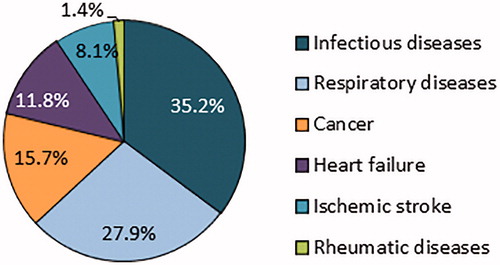
Table 1. Demographics and clinical characteristics of hospitalized population: all and stratified by type of acute medical illness.
Figure 2. Proportions of patients with VTE-related and VTE (primary diagnosis [Dx]) readmissions during the 6-month follow-up stratified by type of acute medical illness. Each full-length horizontal bar indicates the proportion of patients with VTE-related hospital readmissions; the green part of each bar depicts the proportion of readmissions that were associated with a primary Dx for VTE.
![Figure 2. Proportions of patients with VTE-related and VTE (primary diagnosis [Dx]) readmissions during the 6-month follow-up stratified by type of acute medical illness. Each full-length horizontal bar indicates the proportion of patients with VTE-related hospital readmissions; the green part of each bar depicts the proportion of readmissions that were associated with a primary Dx for VTE.](/cms/asset/e321ea05-8e1e-46cf-af4f-0b36adbb6530/ijme_a_1618862_f0002_c.jpg)
Table 2. Associated cost and LOS of VTE-related and VTE (primary diagnosis) hospital readmissions.
Figure 3. Time to VTE-related readmissions among patients with readmissions.
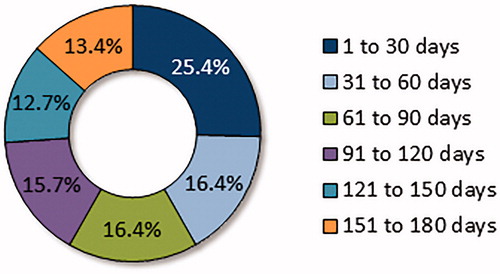
Table 3. Potential predictors of VTE-related and VTE (primary diagnosis) readmissions.