Figures & data
Table 1. Summary of patient baseline characteristics (before and after propensity score match and PLIF sub-group).
Table 2. The summary of the measured surgical outcomes and total cost (before propensity score match and PLIF sub-group).
Table 3. The summary of the measured surgical outcomes and total cost (after propensity score match).
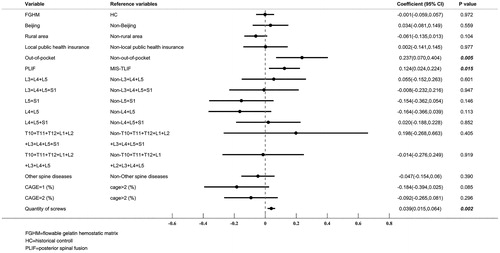
Figure 1. Multiple generalized linear regression analysis assessing the impact of flowable gelatin hemostatic matrix on the total hospitalization costs (n = 190).