
Figures & data
Table 1. Summary of pertinent mapping algorithms of EORTC QLQ-C30 to EQ-5D-3L/-5L.
Table 2. Patient sociodemographic and baseline clinical characteristics in the ALTA trial.
Figure 1. Mean utility scores over time (Khan et al.Citation45 and Longworth et al.Citation43). (A) Mean utility scores (Khan et al.Citation45; EQ-5D-5L) from baseline to cycle 35 day 1, EOT, and follow-up 30 days after last dose by treatment group (study AP26113-13-201): ITT-PRO population. (B) Mean utility scores (Longworth et al.Citation43; EQ-5D-3L) from baseline to cycle 35 day 1, EOT, and follow-up 30 days after last dose by treatment group (study AP26113-13-201): ITT-PRO population.
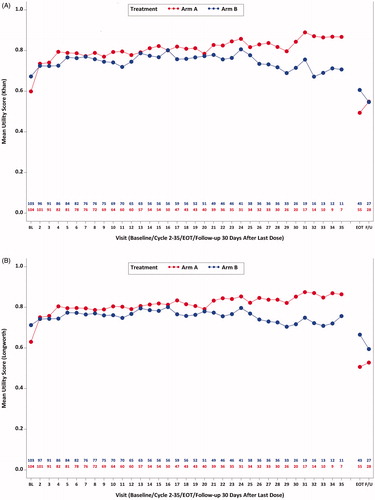
Figure 2. Mean utility change scores over time (Khan et al.Citation45 and Longworth et al.Citation43). (A) Mean change in utility scores (Khan et al.Citation45; EQ-5D-5L) from baseline to cycle 35 day 1, EOT, and follow-up 30 days after last dose by treatment group (study AP26113-13-201): ITT-PRO population. (B) Mean change in utility scores (Longworth et al.Citation43; EQ-5D-5L) from baseline to cycle 35 day 1, EOT, and follow-up 30 days after last dose by treatment group (study AP26113-13-201): ITT-PRO population.
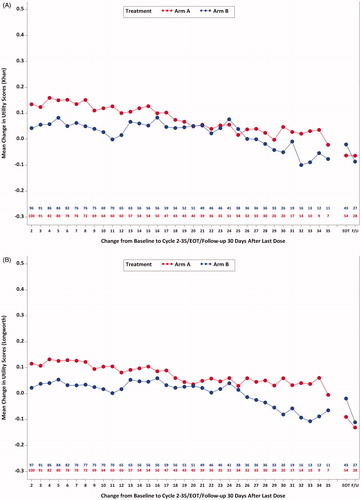
Table 3. Change from baseline in utility scores by visit and treatment group.
Table 4. Change from baseline in utility scores by ECOG performance status results.
Data availability
The ALTA study data (NCT02094573) are proprietary and owned by Millennium Pharmaceuticals, Inc.