
Figures & data
Figure 1. Estimated impact on cervical cancer incidence for different strategies.
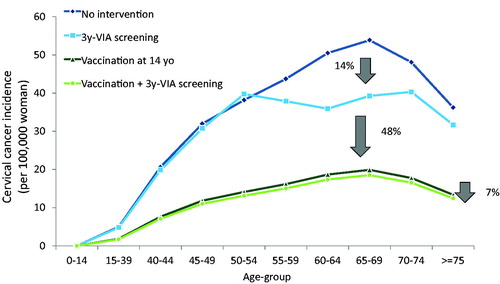
Figure 2. One-way sensitivity analysis for vaccination followed by screening with VIA performed every 3 years.
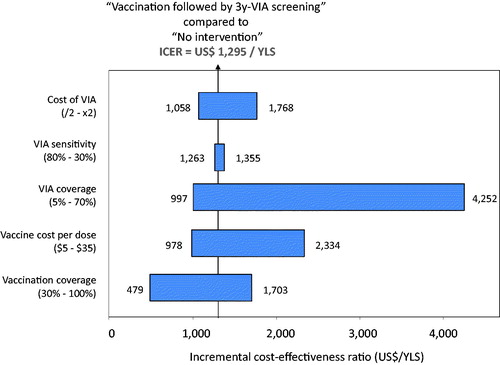
Table 1. Baseline assumptions and direct medical costs indexed at year 2018.
Table 2. Discounted life expectancy (LE), discounted total lifetime cost per woman, and incremental cost-effectiveness ratio for evaluated strategies.
Supplemental material