Figures & data
Figure 1. Simplified model schematic.
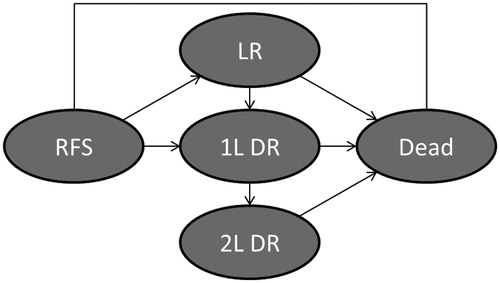
Figure 2. Parametric and Kaplan-Meier survival distributions for (A) RFS, (B) 1LPFS, and (C) 2LOS.
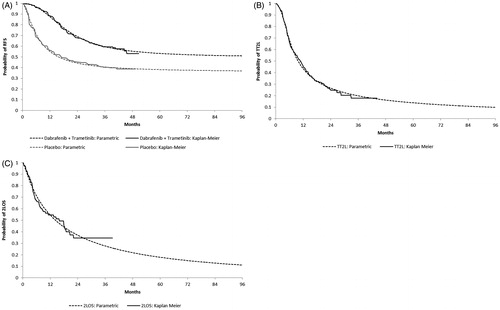
Table 1. Probabilities and utility values.
Table 2. Costs inputs.
Figure 3. Model projections of RFS and OS for dabrafenib plus trametinib and observation.
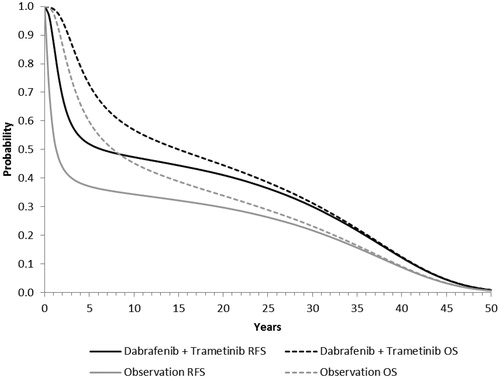
Table 3. Base-case results.
Figure 4. Tornado chart for incremental cost-effectiveness ratio.
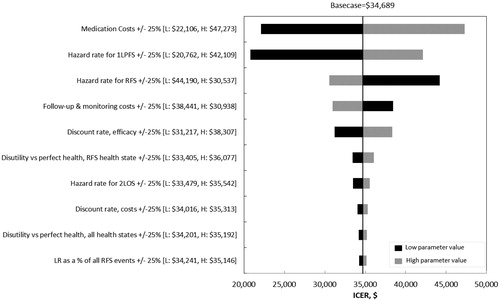
Table 4. Results of scenario analyses.
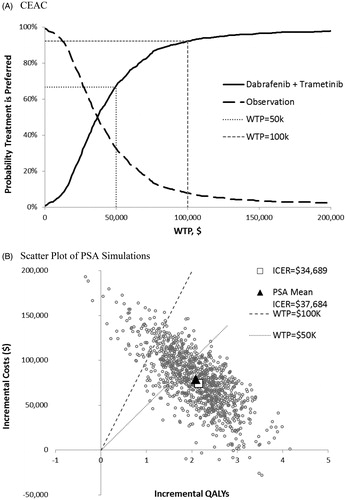
Figure 5. Cost-effectiveness acceptability curve and scatter plot of PSA simulations.