
Figures & data
Table 1. Model assumptions.
Figure 1. Overview of the economic model. The numbers and percentages are based on base-case assumptions and peer-reviewed literature (). Abbreviations. AKI, acute kidney injury; SOC, standard of care; Mod, moderate; Sev, severe.
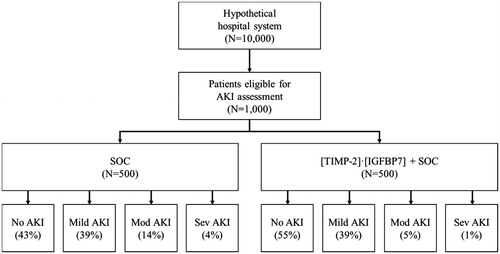
Table 2. Annual net savings by level of AKI severity, overall, and per tested patient.
Table 3. Reduction in overall clinical burden and resulting budget impact by AKI severity, overall and per patient.
Figure 2. Results of the deterministic sensitivity analyses. Monetary values are in 2017 US$. Abbreviations. AKI, acute kidney injury; ICU, intensive care unit; SOC, standard of care.
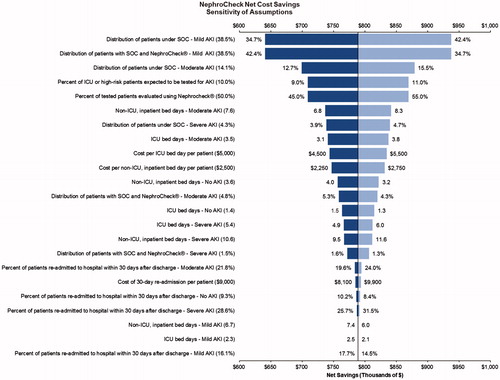
Figure 3. Results of the probabilistic sensitivity analyses. Out of 5,000 iterations, adding [TIMP-2]·[IGFBP7] to SOC resulted in net savings over 99% of the time. Monetary values are in 2017 US$. Abbreviation. SOC, standard of care.
![Figure 3. Results of the probabilistic sensitivity analyses. Out of 5,000 iterations, adding [TIMP-2]·[IGFBP7] to SOC resulted in net savings over 99% of the time. Monetary values are in 2017 US$. Abbreviation. SOC, standard of care.](/cms/asset/1deec89e-babd-46ff-8471-f12297fafbf4/ijme_a_1636053_f0003_c.jpg)