Figures & data
Figure 1. Budget impact model structure.
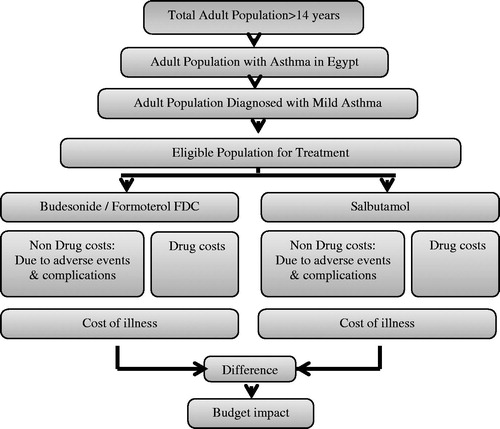
Table 1. Model input parameters.
Table 2. Market penetration for treatment options.
Figure 2. The total annual costs (drug and non-drug) of current and new scenarios in mild asthma from an HIO perspective. (a) The total drug costs for the two scenarios. (b) The total non-drug costs for the two scenarios. (c) The total drug costs per patient for the two scenarios. (d) The total non-drug costs per patient for the two scenarios.
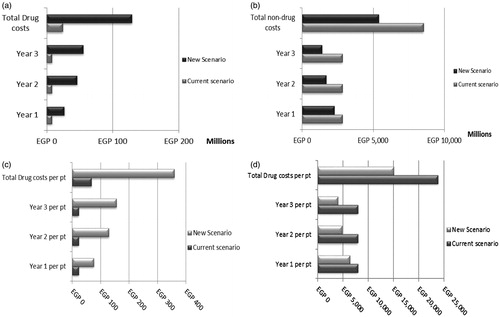
Table 3. The total direct annual costs (drug and non-drug) of current and new scenario in mild asthma.
Figure 3. The total number of exacerbations of current and new scenarios in mild asthma from an HIO perspective.
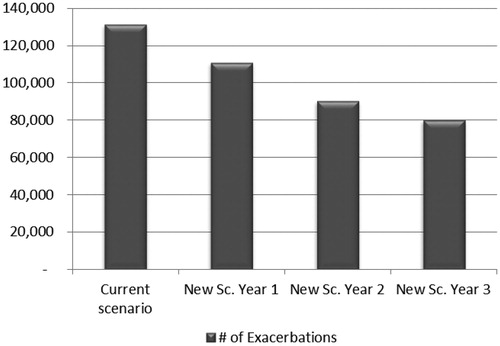
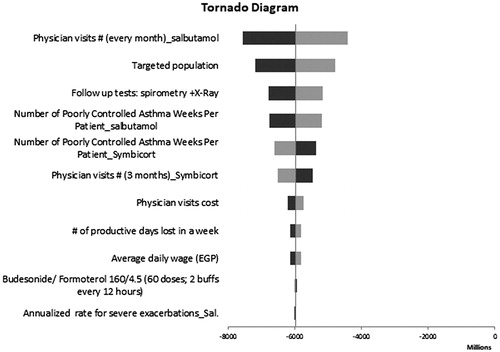
Figure 4. One-way sensitivity results from an HIO perspective. Black bars indicate the higher values while the grey bars indicate the lower values.
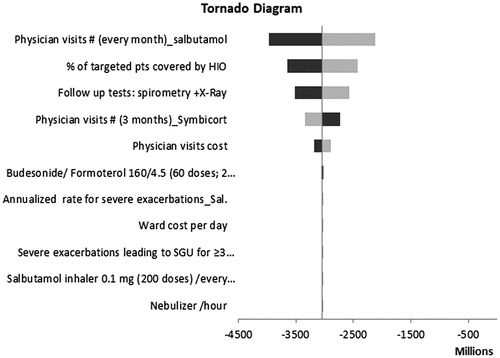
Figure 5. One-way sensitivity results from a societal perspective. Black bars indicate the higher values while the grey bars indicate the lower values.