
Figures & data
Figure 1. Study schematic.
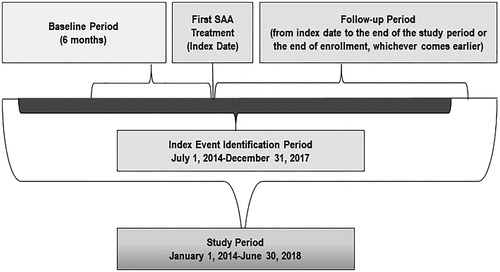
Figure 2. Patient selection.
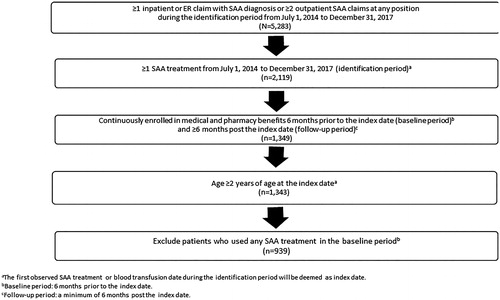
Table 1. Demographic characteristics.
Table 2. First-line treatments.
Table 3. Monthly all-cause and SAA-related HCRU in the follow-up period.
Table 4. Monthly all-cause and SAA-related direct costs in the follow-up period.
Table 5. Examples of yearly economic burden of chronic hematologic diseases.
Supplemental material