659
Views
1
CrossRef citations to date
0
Altmetric
Addiction Medicine

Modeling the potential impact of abuse-deterrent opioids on medical resource utilization

, , , , &
Pages 1073-1079 | Received 24 Apr 2019, Accepted 10 Jul 2019, Published online: 13 Aug 2019

Figures & data

Figure 1. Estimated reductions in non-medical use. Abbreviations. ADO, abuse-deterrent opioid; Emax, mean maximum effect; NMU, non-medical use; NSDUH, National Survey on Drug Use and Health. This figure reflects calculation steps for agonist/antagonist ADOs only. Physical barrier ADOs have a drug liking Emax of 80.4 mm, resulting in a 12.7% reduction in predicted NMU rate. The difference in drug liking Emax was converted to point reductions in NMU according to White et al.Citation12 and used to calculate the percent reduction in predicted NMU rate. Notes: (1) ‘mm’ represents millimeters, which are one unit on the Drug Liking scale measured from 0–100. (2) The 30.6 percent reduction in the predicted NMU rate associated with replacement of a non-ADO with an ADO is calculated by dividing the predicted percentage point reduction in the NMU rate associated with replacement of a non-ADO with an ADO (∼0.43 percentage points) by the NMU rate associated with non-ADO as reported by the NSDUH (∼1.40 percentage points).

Figure 1. Estimated reductions in non-medical use. Abbreviations. ADO, abuse-deterrent opioid; Emax, mean maximum effect; NMU, non-medical use; NSDUH, National Survey on Drug Use and Health. This figure reflects calculation steps for agonist/antagonist ADOs only. Physical barrier ADOs have a drug liking Emax of 80.4 mm, resulting in a 12.7% reduction in predicted NMU rate. The difference in drug liking Emax was converted to point reductions in NMU according to White et al.Citation12 and used to calculate the percent reduction in predicted NMU rate. Notes: (1) ‘mm’ represents millimeters, which are one unit on the Drug Liking scale measured from 0–100. (2) The 30.6 percent reduction in the predicted NMU rate associated with replacement of a non-ADO with an ADO is calculated by dividing the predicted percentage point reduction in the NMU rate associated with replacement of a non-ADO with an ADO (∼0.43 percentage points) by the NMU rate associated with non-ADO as reported by the NSDUH (∼1.40 percentage points).

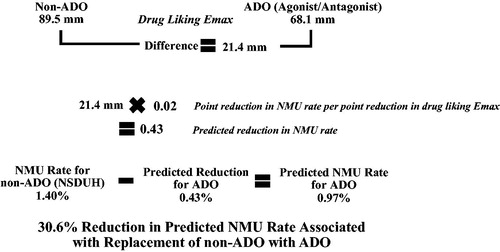
Table 1. Key model inputs.

Table 2. Estimated annual avoided medical events and costs.Table Footnotea

Table 3. Overall medical cost savings and avoided ED visits.

Reprints and Corporate Permissions

Please note: Selecting permissions does not provide access to the full text of the article, please see our help page How do I view content?

To request a reprint or corporate permissions for this article, please click on the relevant link below:

Academic Permissions

Please note: Selecting permissions does not provide access to the full text of the article, please see our help page How do I view content?

Obtain permissions instantly via Rightslink by clicking on the button below:

If you are unable to obtain permissions via Rightslink, please complete and submit this Permissions form. For more information, please visit our Permissions help page.