
Figures & data
Table 1. Overview of the key features of the model.
Figure 1. Markov model structure for cost-effectiveness of ICM use in patients with a history of cryptogenic stroke and suspected AF. *These additional adverse events can cause treatment switches, but no transitions between shown health states. AF: atrial fibrillation; CRNM: clinically relevant non-major; ECH: extracranial hemorrhage; FN: false negative; FP: false positive; GI: gastrointestinal; HS: hemorrhagic stroke; ICH: intracranial hemorrhage; TIA: transient ischemic attack; SE: systemic embolism; TN: true negative; TP: true positive.
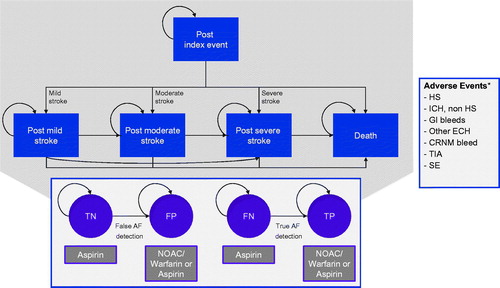
Figure 2. AF detection rates over 36 months of monitoring.
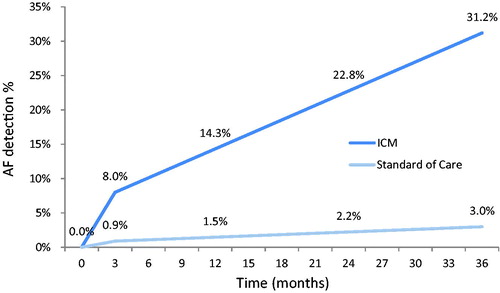
Table 2. Estimated annual ischemic stroke risk by CHADS2 score.
Table 3. Annual risks of adverse events in patients with prior stroke or TIA.
Table 4. Case fatality rates.
Table 5. Baseline health state utility estimates used in the model by diagnosis and health state.
Table 6. Health state disutilities from adverse events.
Table 7. Costs US$ included in the analysis.
Table 8. Key model outputs based on discounted values for a cohort of one patient.
Table 9. Events, total costs, life-years and QALYs per patient.
Figure 3. Tornado graph of parameters shown in the one-way sensitivity analysis to have the greatest impact on the cost-effectiveness of ICM use (cost in US$per QALY gained). The vertical line represents the base-case ICER for ICMs versus SoC. The horizontal bars indicate the ICER range between their low and high values.
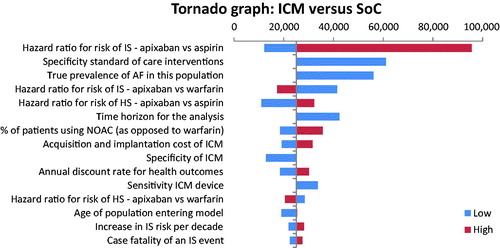
Figure 4. Cost-effectiveness plane illustrating the lifetime differences in costs and outcomes (QALYs) between the two management strategies: ICM versus SoC.
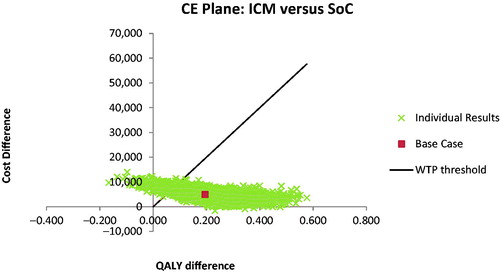
Figure 5. Cost-acceptability curve summarizing the impact of uncertainty on the cost-effectiveness or willingness-to-pay threshold.
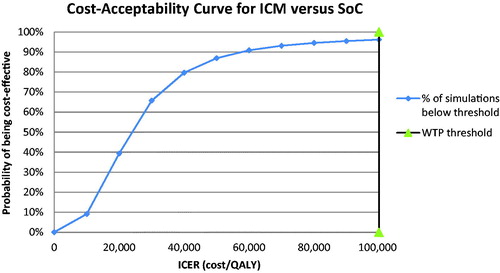
Table 10. Parameters having the greatest impact in terms of cost-effectiveness outcomes on the one-way sensitivity analysis.