
Figures & data
Figure 1. Model structure. Abbreviations. NYHA, New York Heart Association; MV, mitral valve; CHF, congestive heart failure. MitraClip complications, adverse events, re-implantation with MitraClip, MV surgery and CHF hospitalization are considered in the analytical model.
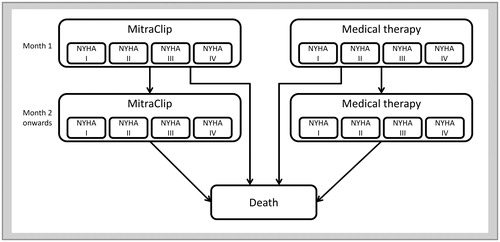
Table 1. Transition probability.
Table 2. Cost.
Table 3. QOL value.
Figure 2. Tornado diagram. For parameters with asterisk (*), 95% CI is used as a range of sensitively analysis. The range of ±20% of baseline value is chosen for the rest of parameters. Abbreviations. ICER, incremental cost-effectiveness ratio; QALY, quality adjusted life year; HR, hazard ratio; OS, overall survival; CHF, congestive heart failure; NYHA, New York Heart Association; MI, myocardial infarction; MV, mitral valve; CI, confidence interval.
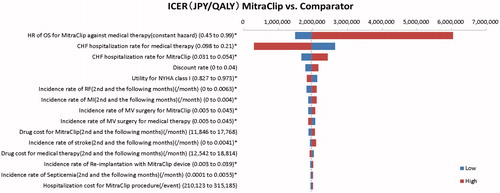
Figure 3. Probabilistic sensitivity analysis. (A) Cost-effectiveness plane, and (B) cost-effectiveness acceptability curve. Abbreviations. QALY, quality adjusted life year; WTP, willingness to pay.
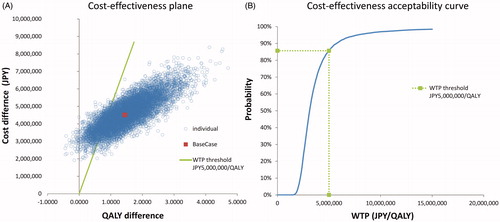
Table 4. Results of base-case and scenario analysis.