Figures & data
Table 1. Base case inputs and assumptions.
Figure 1. Markov model diagram of onabotulinumtoxinA for the preventive treatment of chronic migraine. Reproduced from Batty et al.Citation23.
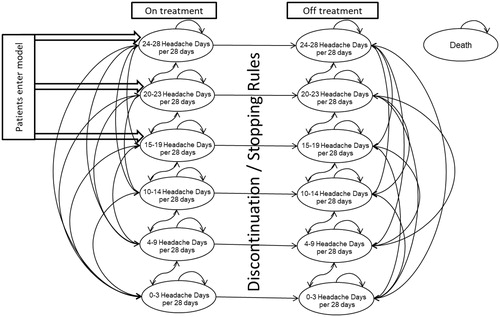
Figure 2. Transition probabilities with 30% negative stopping rule applied for patients with chronic migraine who have previously received three or more preventive treatments.
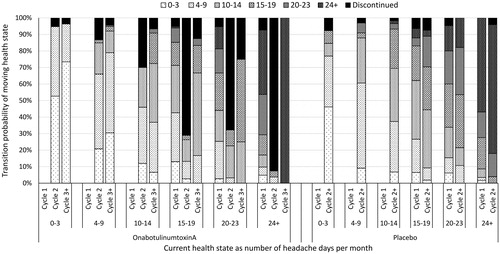
Figure 3. Utility values used in the original model (from PREEMPT; number of observations = 359) and the revised model (from REPOSE; number of observations = 3,524) with standard error bars.
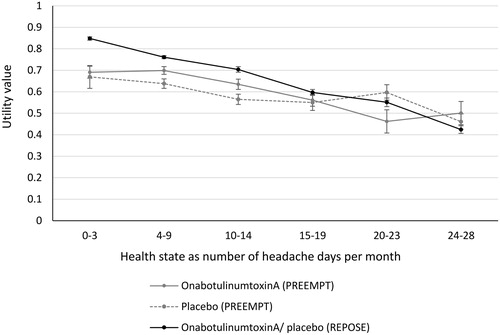
Table 2. Cost of care per 12-week cycle by health state.
Table 3. Deterministic base case results with disaggregated costs and QALYs.
Table 4. Deterministic base case results and scenario analysesTable FootnoteΛ.
Figure 4. Cost effectiveness plane: probabilistic sensitivity analysis results for model base case.
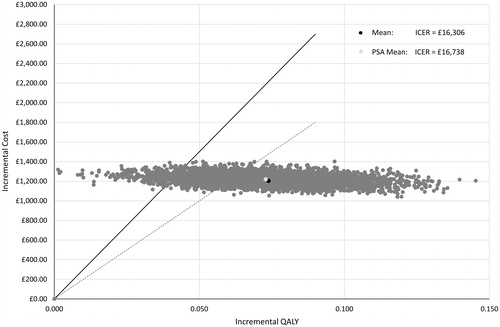
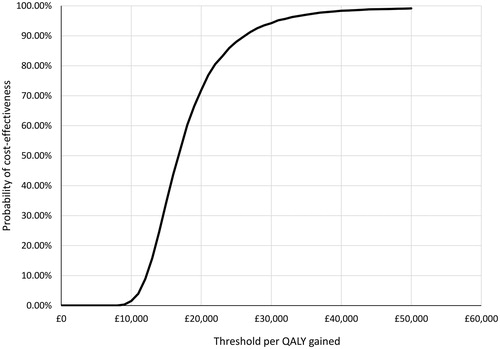
Figure 5. Cost effectiveness acceptability curve: probabilistic sensitivity analysis results for model base case.