
Figures & data
Figure 1. Flow diagram for number of grade 3–4 adverse events costed, by adverse event. HCRU: health care resource use.
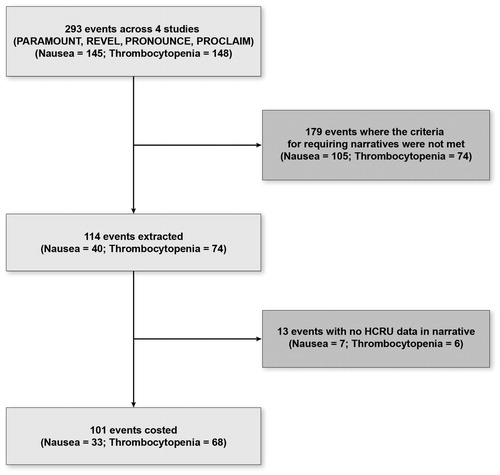
Table 1. Percentages of AEs eligible for costing with information recorded in patient narratives pertaining to key HCRU: nausea.
Table 2. Percentages of AEs eligible for costing with information recorded in patient narratives pertaining to key HCRU: thrombocytopenia.
Table 3. Extent of known missing data for medication use: nausea.
Table 4. Extent of known missing data for platelet transfusions: thrombocytopenia.
Table 5. Extent of missing data for duration of hospitalization.
Table 6. Costs to treat nausea (all events recorded as Grade 3), per adverse event (2017 USD), by resource use component.
Table 7. Costs to treat grade 3–4 thrombocytopenia per event (2017 USD), by resource use component.
Table 8. Impact of imputing missing data for hospitalization.