Figures & data
Figure 1. Patient selection flow diagram. 1Diagnoses for SZ were based on ICD-9 codes 295.xx; and ICD-10 codes F20.x and F25.x from the Medicaid claims database (the most recent 6 years for data of each state). 2Diagnoses for BD were based on ICD-9 codes 296.0x, 296.1x, 296.4x, 296.5x, 296.6x, 296.7x, or 296.8x; ICD-10 codes F30.x and F31.x. 3Diagnoses for MDD were based on ICD-9 codes 296.2x and 296.3x; ICD-10 codes F32.x and F33.x. Abbreviations. BD, bipolar disorder; ICD, International Classification of Diseases; MDD, major depressive disorder; SZ, schizophrenia.
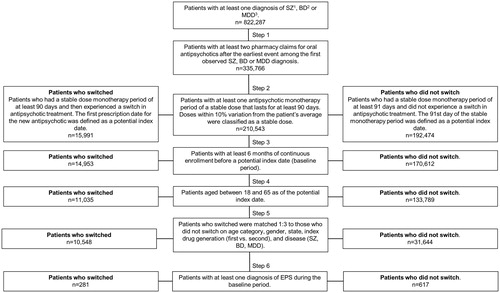
Table 1. Baseline characteristics of overall patients and patients with ≥1 EPS diagnosis.
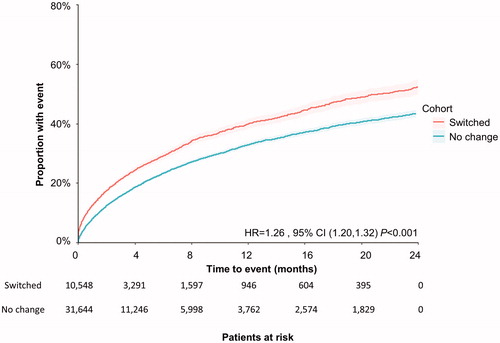
Figure 2. Time to first disease relapse during the 2-year study period among all patients. Patient claims were analyzed for disease relapse after switching antipsychotic medication. Outcomes for both cohorts (those who switched, and those who did not) were assessed using Kaplan–Meier analysis and compared using a log-rank test. The number of patients at risk is represented for each time point. Abbreviations. CI, confidence interval; HR, hazard ratio.
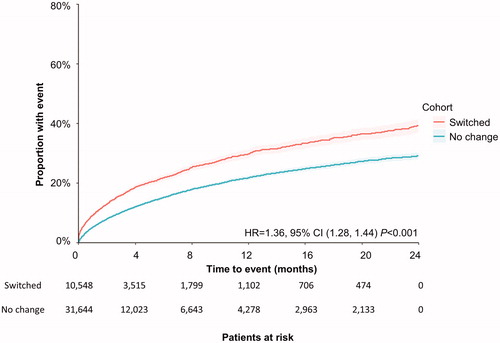
Figure 3. Time to first psychiatric admission during the 2-year study period among all patients. Patient claims were analyzed for first psychiatric admission following switching of antipsychotic medication. Outcomes for both cohorts (those who switched, and those who did not) were assessed using Kaplan–Meier analysis and compared using a log-rank test. The number of patients at risk is represented for each time point. Abbreviations. CI, confidence interval; HR, hazard ratio.
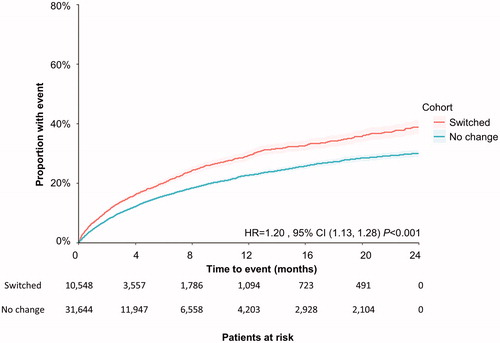
Figure 4. Time to first IP admission during the 2-year study period among all patients. Patient claims were analyzed for IP admission following switching of antipsychotic medication. Outcomes for both cohorts (those who switched, and those who did not) were assessed using Kaplan–Meier analysis and compared using a log-rank test. The number of patients at risk is represented for each time point. Abbreviations. CI, confidence interval; HR, hazard ratio; IP: inpatient.