
Figures & data
Table 1. Weinstein and Sendi’s utility values according to CD4 count +/− AIDS status and VL.
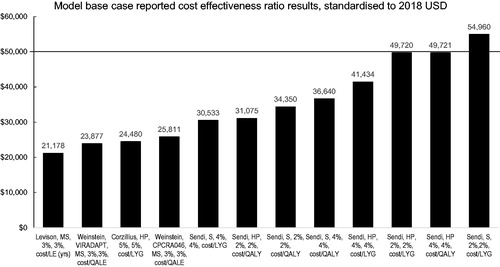
Figure 1. Standardized incremental cost effectiveness ratios (2018 USD). Author, study (if relevant), perspective, cost discount rate, outcome discount rate, output measure. HP, healthcare payer (public); MS, modified societal; S, societal. Phillips results not directly comparable because results are reported as total (2015–2025) incremental cost of $191.1m per 139,589 Disability Adjusted Life Years (DALYs) averted over ten years compared to a no monitoring strategy (discounted at 3.5%) (Phillips 2014 referencing Figure 2)Citation25.
Supplemental material