Figures & data
Figure 1. Three-state partitioned survival cost-utility model.
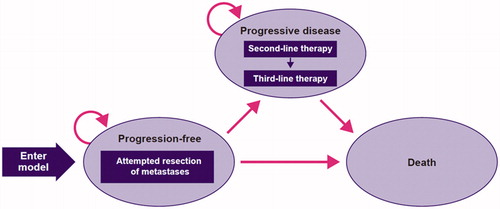
Figure 2. Modeled overall survival based on directly including Kaplan-Meier (KM) data of the final RAS wild-type population in the FIRE-3 trial (this graph is based on Excel, and KM steps are not perfectly translated into Excel). Abbreviation. IPD, individual patient data.
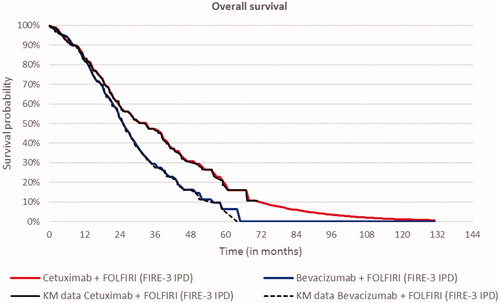
Figure 3. Modeled progression-free survival based on directly including Kaplan-Meier (KM) data of the final RAS wild-type population in the FIRE-3 trial (this graph is based on Excel, and KM steps are not perfectly translated into Excel). Abbreviation. IPD, individual patient data.
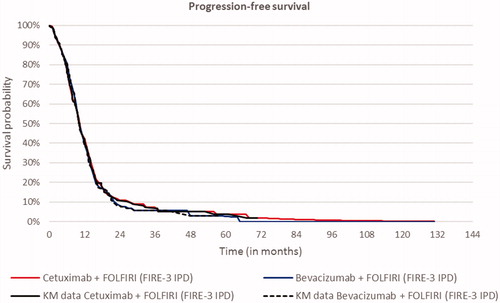
Table 1. Incremental cost-effectiveness ratios.
Figure 4. One-way sensitivity analyses in RAS wild-type patient population.
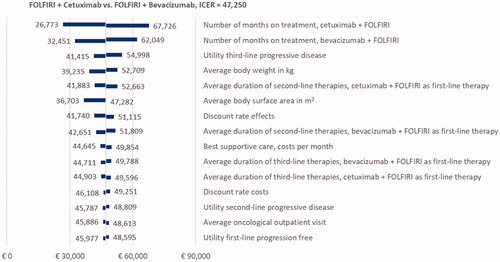
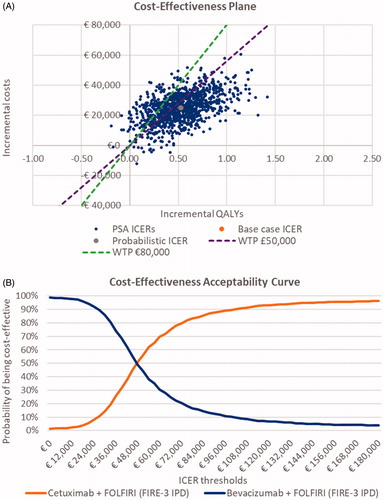
Figure 5. Probabilistic sensitivity analyses. A, Cost-effectiveness plane, RAS wild-type (wt) patient population (base case). B, Cost-effectiveness acceptability curve, RAS wt patient population (base case). Abbreviations. ICER, incremental cost-effectiveness ratio; IPD, individual patient data; PSA, probabilistic sensitivity analysis; QALY, quality-adjusted life-year; WTP, willingness to pay.