
Figures & data
Figure 1. Schematic representation of partitioned survival model and disease health state transitions.
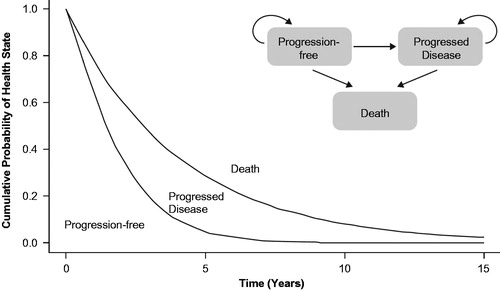
Table 1. Absolute value estimates of health outcomes and costs associated with each treatment in the model.
Table 2. Incremental gains with nivolumab vs investigator’s choice.
Figure 2. Deterministic sensitivity analysis of ICER response to variability of input parameters for nivolumab vs investigator’s choice arm. Abbreviations. ICER, incremental cost-effectiveness ratio; OS, overall survival; PD, progressed disease; PF, progression-free. Range of input variability: ±standard error for utility values; ±20% for all other inputs values.
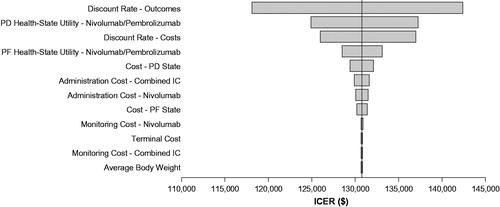
Table 3. Probabilistic sensitivity analysis of health outcomes and costs associated with each treatment in 1,000 model iterations.