
Figures & data
Table 1. Estimated proportion of patients achieving treatment targets.
Table 2. Wholesale acquisition cost applied in the analysis.
Figure 1. Annual cost of treatment. Abbreviations. BID, twice daily; QD, once daily; QW, once weekly; USD, 2019 United States dollars.
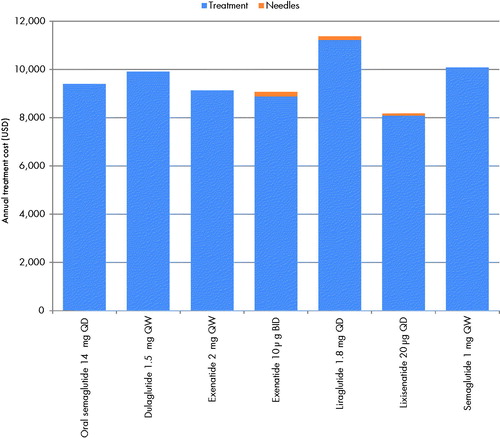
Figure 2. Number needed to treat to bring one patient to target. Abbreviations. BID, twice daily; HbA1c, glycated hemoglobin; QD, once daily; QW, once weekly.
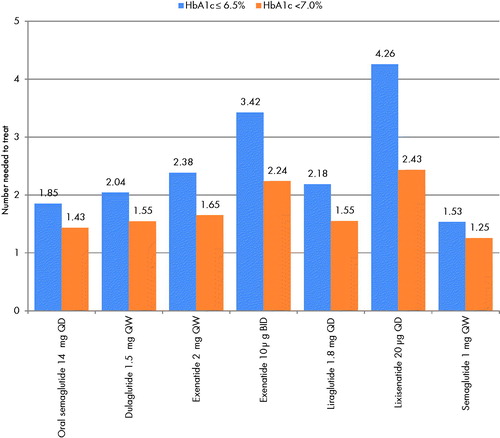
Figure 3. Cost of control. Abbreviations. BID, twice daily; HbA1c, glycated hemoglobin; QD, once daily; QW, once weekly; USD, 2019 United States dollars.
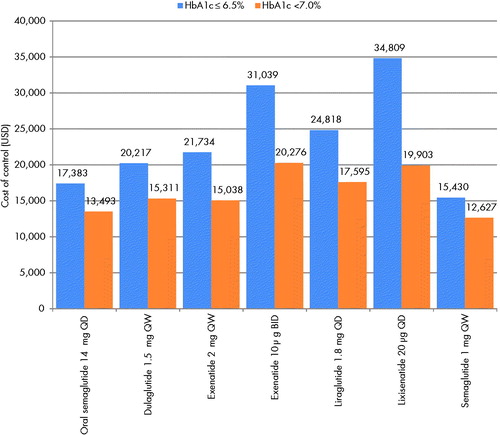
Table 3. Results of the probabilistic sensitivity analysis.
Data availability statement
All data used in the analysis are included in the manuscript.