Figures & data
Figure 1. Markov model structure illustrated with the sequence of events. Event-free, free of further myocardial infarction or ischemic stroke on the entry; Abbreviations. MI, myocardial infarction; IS, ischemic stroke; XX, either MI or IS.
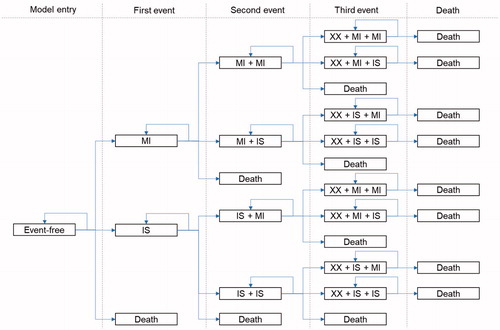
Table 1. The transition probabilities sourced from the post-hoc analysis of the peripheral arterial disease sub-group of the CAPRIE trial.
Table 2. Relative risks of ischemic events for the PAD sub-group with high-risk factors vs the general PAD sub-group.
Table 3. Utility values of health states in the model.
Table 4. Cost parameters used in the model.
Table 5. Cost-effectiveness analysis results.
Figure 2. One-way sensitivity analysis tornado diagram for PAD with the pre-existing symptomatic atherosclerotic disease sub-population. Abbreviations. RR, relative risk; CV, cardiovascular; PRE-AS, pre-existing symptomatic atherosclerotic disease; MI, myocardial infarction.
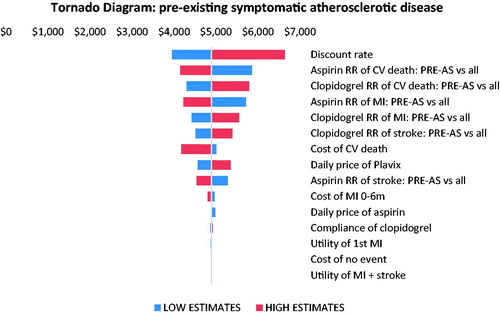
Figure 3. One-way sensitivity analysis tornado diagram for PAD with a multi-vascular territory involvement sub-population. Abbreviations. RR, relative risk; CV, cardiovascular; PVD, polyvascular disease; MI, myocardial infarction.
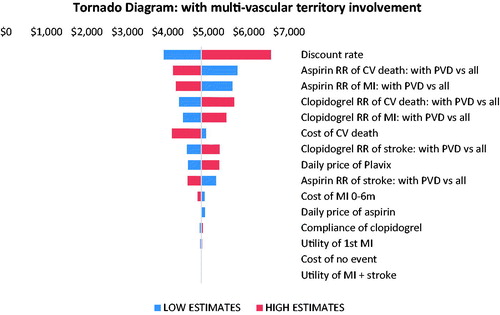
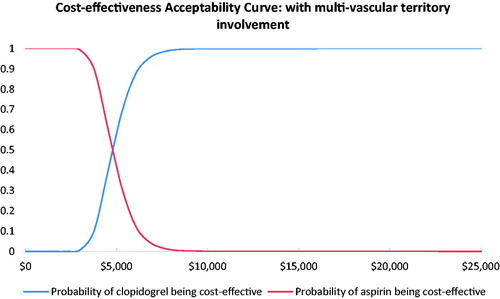
Figure 4. Probabilistic sensitivity cost-effectiveness acceptability curve for PAD with a pre-existing symptomatic atherosclerotic disease sub-population.
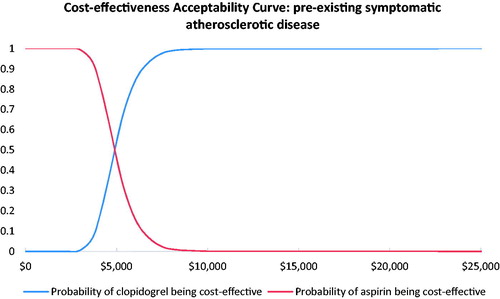
Figure 5. Probabilistic sensitivity cost-effectiveness acceptability curve for PAD with a multi-vascular territory involvement sub-population.