
Figures & data
Figure 1. Derivation of target population. aAssuming 0.5% RA prevalenceCitation19. bAssuming 65.5% of RA patients have moderate to severe disease activityCitation20. cAssuming 88.4% of patients use DMARD therapyCitation21, of whom 39% use csDMARD and 61% use non-csDMARDCitation22. 88.4% × 61% = 53.9%; 88.4% × 39% × 36.9% csDMARD non-responderCitation22 = 12.7%. Abbreviations. csDMARD, conventional synthetic disease-modifying antirheumatic drug; DMARD, disease-modifying antirheumatic drug; JAKi, Janus kinase inhibitor; RA, rheumatoid arthritis.
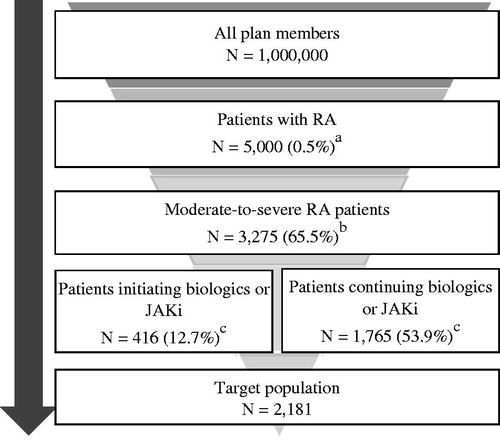
Table 1. Treatment options and market share scenarios.
Table 2. Medication costs (2019 US Dollars).
Table 3. Base case results: 30% rebate for adalimumab and etanercept, overall patients (2019 USD).
Table 4. Scenario analyses results (2019 USD).