Figures & data
Figure 1. Scorecard for osteoporosis in Saudi Arabia. Abbreviations. DXA, dual-energy x-ray absorptiometry; FLS, fracture liaison service; FRAX, fracture risk assessment model; NHP, national health priority.
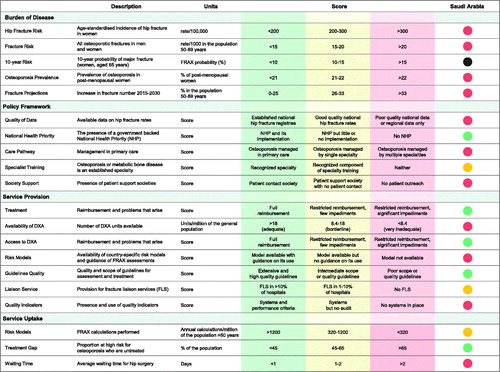
Table 1. Epidemiological measures of osteoporosis burden in Saudi Arabia.
Table 2. Estimated number of fractures among adults aged 50–89 years in Saudi Arabia.
Table 3. Estimated economic burden of osteoporosis in Saudi Arabia for 2019.
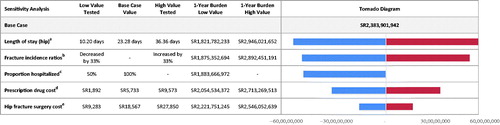
Figure 2. One-way sensitivity analyses for the estimated economic burden of osteoporosis in Saudi Arabia (2019). Abbreviation. SR, Saudi Riyal. 3.75 Saudi Riyal = 1 United States dollar. The tornado diagram displays the difference in one-year burden when comparing the results of the sensitivity analyses to the results of the base case analysis. a ± 13.08 days of base case value. Based on standard deviation in Sadat-Ali et al.Citation8 The hospital lengths of stay for vertebral, wrist, and other fractures were varied in proportion to the change in hip fracture. b ± 33% (proportion of base case value). Range informed by Siggeirsdottir et al.Citation43 cAssumption informed by expert opinion. d ± 67% (proportion of base case value). Range informed by expert opinion. e ± 50% (proportion of base case value). Upper bound informed by Sadat-Ali et al.Citation8 Note, additional details of cost breakdown were supplied by the authors.