
Figures & data
Figure 1. Study design. A summary of extracting SLE cohort by applying an algorithm when working with data from claims database. Abbreviation. SLE, systemic lupus erythematosus.
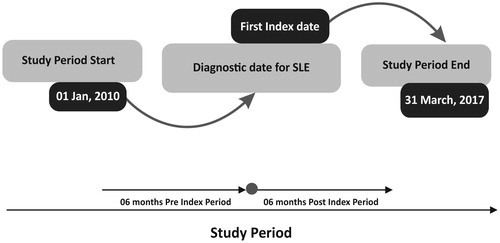
Figure 2. Patient selection flowchart. Abbreviations: CNS- Central Nervous System, ICD-10 – International Classification of Disease 10th revision, JMDC, Japan medical data center; SLE, systemic lupus erythematosus.
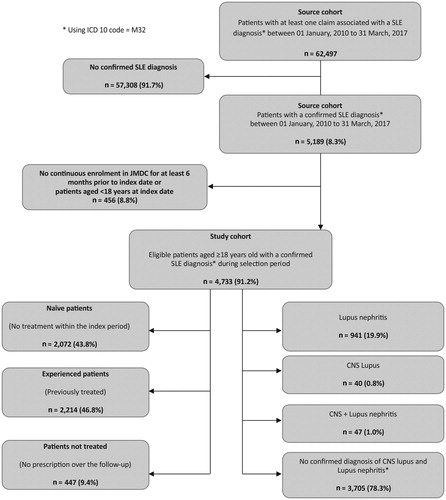
Table 1. Baseline demographics and comorbidities of patients with SLE (by Severity Level) during selection period.
Table 2. Treatment regimen per treatment line in all treatment naïve patients with SLE.
Table 3. Treatment persistence/patterns and treatment-related events according to the treatment regimen dispensed.
Figure 3. Distribution of oral glucocorticoid doses per calendar year. Days are represented as mean.
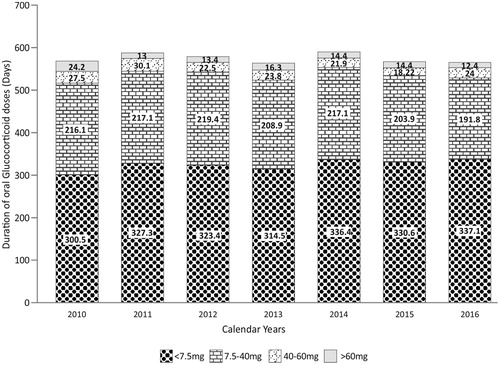
Table 4. Distribution of glucocorticoid doses after index date in patients with SLE.
Table 5. Healthcare resource utilization during follow-up period.
Table 6. Healthcare resource utilization in treatment naïve patients by first treatment line and by treatment classes.
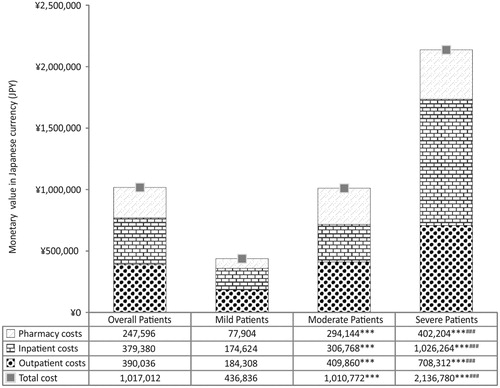
Figure 4. Direct healthcare cost of Japanese SLE patients. Total healthcare costs of SLE in Japanese patients, estimated during entire follow up period of the study. Data are plotted as mean of the total patient number in the cohort/sub-cohort. Costs of patients with severe, moderate, and mild SLE were compared against each other using two-sample T-test. ***p<.001 compared with mild SLE group and ###p<.001 compared with moderate SLE group.
Supplemental Material
Download ()Data availability
The datasets analyzed during the current study are not publicly available due to copyright reasons but are available from the corresponding author on reasonable request.