
Figures & data
Figure 1. Cohort selection. Abbreviations. PMF, Primary Myelofibrosis; sMF, Secondary Myelofibrosis; PV, Polycythemia Vera; ET, Essential Thrombocythemia; SM, SEER Medicare; TR, Truven; OP, Optum.
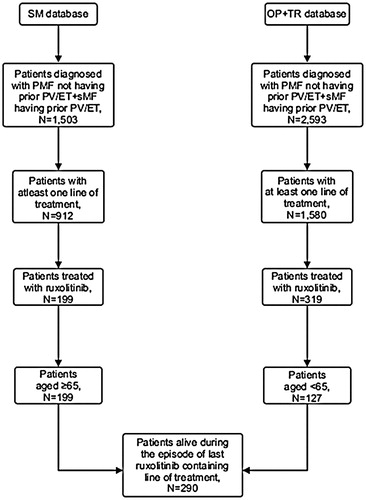
Table 1. Baseline characteristics.
Table 2. Treatment emergent morbidities and transfusions.
Figure 2. Cumulative incidence of cytopenias in the presence of death as a competing event. The Y-axis is the cumulative probability of development of new cytopenia and the x-axis is time of first diagnosis of cytopenia. Cytopenias include anemia, neutropenia and thrombocytopenia.
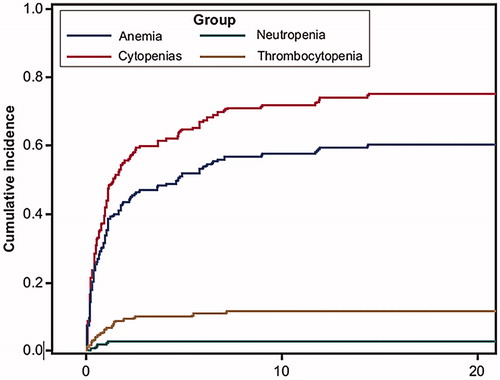
Figure 3. OS, TPFS and TTNT of patients. Time to event analysis in the sample of myelofibrosis patients that discontinued ruxolitinib (n = 290). X-axis represents the event free probability and y-axis represents the follow-up time after ruxolitinib discontinuation. Event = death (Overall survival [OS] analysis), earlier of treatment progression/death (time to progression free survival [TPFS] analysis) and treatment progression (time to next treatment [TTNT] analysis).
![Figure 3. OS, TPFS and TTNT of patients. Time to event analysis in the sample of myelofibrosis patients that discontinued ruxolitinib (n = 290). X-axis represents the event free probability and y-axis represents the follow-up time after ruxolitinib discontinuation. Event = death (Overall survival [OS] analysis), earlier of treatment progression/death (time to progression free survival [TPFS] analysis) and treatment progression (time to next treatment [TTNT] analysis).](/cms/asset/d7df35d4-1aa9-4a65-b2f8-7a361980e70d/ijme_a_1741381_f0003_c.jpg)
Table 3. Time to event efficacy outcomes.
Supplemental Material
Download MS Word (13 KB)Availability of data and material
The data and protocol of this study are not publicly available but are available upon contact with [email protected] on reasonable request.