
Figures & data
Figure 1. Model schematic.
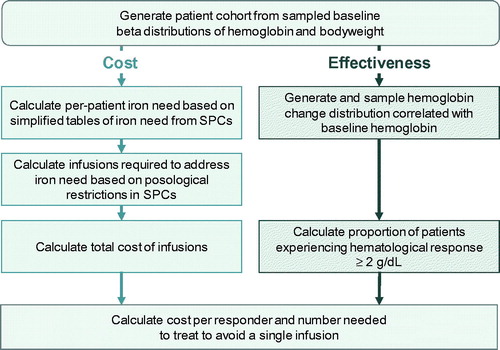
Table 1. Characteristics of studies included in the indirect treatment comparison.
Table 2. Overview of iron deficiency anemia treatment activity and tariffs by healthcare resource group.
Figure 2. Scatterplot, least squares regression, and contour plot of the relationship between baseline hemoglobin and change from baseline hemoglobin in patients in the PROVIDE randomized controlled trialCitation20.
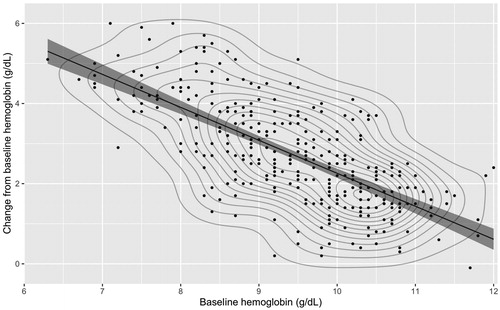
Figure 3. Scatterplot and least squares regression models of baseline hemoglobin and change from baseline hemoglobin distributions for iron isomaltoside and ferric carboxymaltose in simulated patient cohorts of 100,000 patients in each arm.
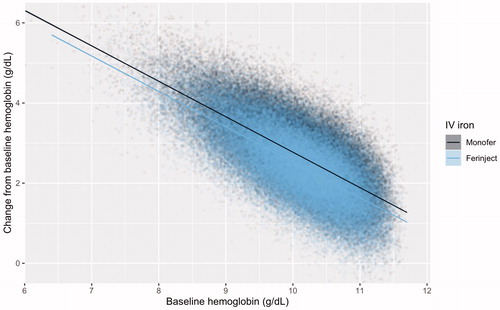
Table 3. Hematological, posological, and economic results from the base case analysis of 100,000 simulated patients.
Figure 4. Kernel density plots showing sampled beta distributions of (A) baseline hemoglobin and (B) change from baseline hemoglobin parameterized using patient-level data from the iron isomaltoside arm of the PROVIDE randomized controlled trial and the difference in change from baseline hemoglobin from an indirect treatment comparison. (C) The final modeled hemoglobin distributionsCitation15,Citation21. Abbreviations. FCM, ferric carboxymaltose; IIM, iron isomaltoside/ferric deriosmaltose; IV, intravenous.
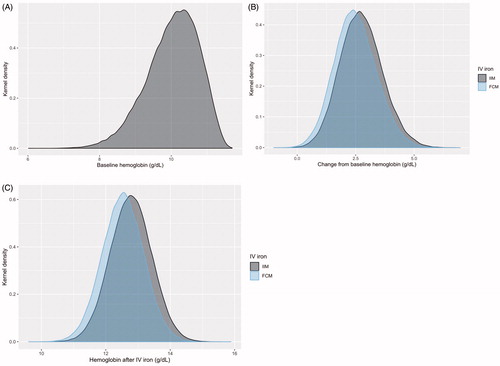
Table 4. One-way sensitivity analysis results.