Figures & data
Figure 1. Structure of the Model for Predicting Cost Effectiveness. Abbreviations. ED, emergency department; OCS, oral corticosteroids.
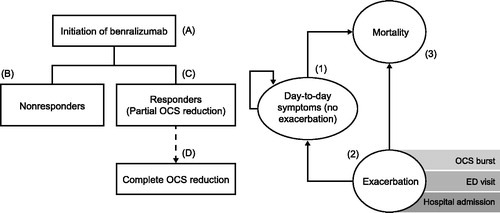
Table 1. Regular OCS Inputs in the Base Case Model.
Table 2. Results from Base Case Cost-effectiveness Analysis.
Figure 2. Cost-effectiveness Plane for Benralizumab vs. SOC Plus OCS from Probabilistic Sensitivity Analysis. Abbreviations. OCS, oral corticosteroids; QALY, quality-adjusted life-year; SEK, Swedish Kronor (2018); SOC, standard of care. Values shown indicate the uncertainty around the incremental cost-effectiveness ratio.
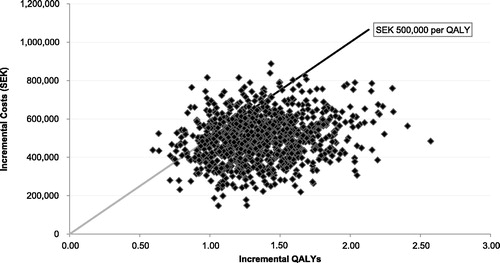
Figure 3. Cost-effectiveness Acceptability Curve for Benralizumab vs. SOC plus OCS. Abbreviations. OCS, oral corticosteroid; SEK, Swedish Kronor (2018); SOC, standard of care.
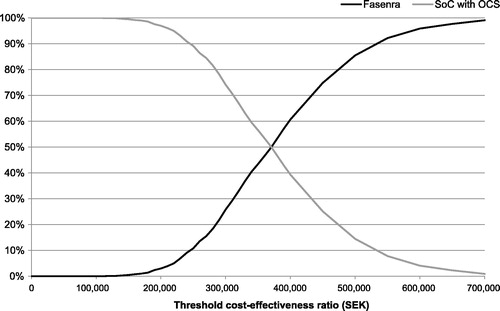
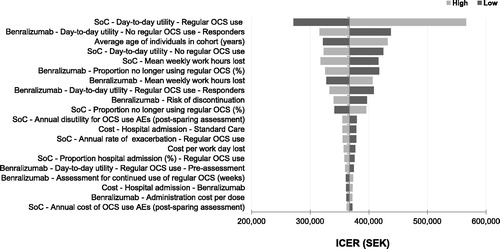
Figure 4. Parameters with the Greatest Impact on the ICER. Based on univariate sensitivity analysis. Abbreviations. AE, adverse event; ICER, incremental cost-effectiveness ratio; OCS, oral corticosteroids; SEK, Swedish Kronor (2018); SOC, standard of care.