Figures & data
Figure 1. Health states used in the Markov microsimulation model.
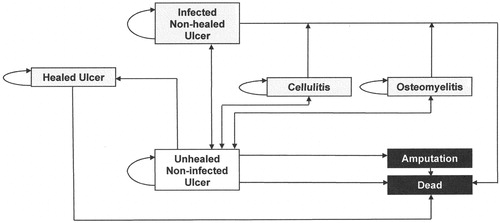
Table 1. Direct costs based on time-based activity-based costing (2019; US dollars).
Table 2. Calculation of ASP cost for different sizes of dHACA. Cost is $155.61 per square centimeter.
Table 3. Example of resource items, resource units, and calculation of costs for cycle 0 for both treatment groups. Totals ±$0.01 due to rounding errors.
Table 4. Cycle costs ($) for model states.
Table 5. Variables used in sensitivity analysis, rationale for using them, and values used in the analysis.
Table 6. Cycle probability rates for healing rates for both study groups. Note cycle 0 corresponds to the day of randomization in the trial; cycle 12 corresponds to week 12 in the trial.
Figure 2. Tornado diagram showing influence of increasing or decreasing key cost and health state transition rate variables over the base case ICER using units of $/QALY (group 1 versus group 2). Note. units are expressed as the relative expected change in ICER.
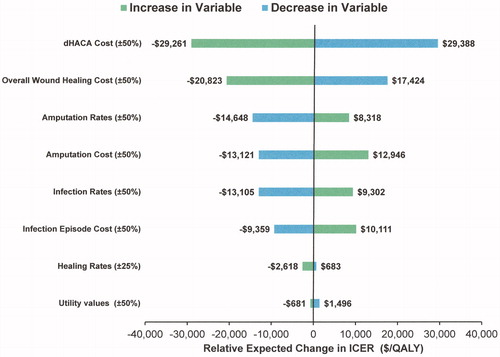
Figure 3. ICE scatterplot. ICE scatterplot of group 1 versus group 2. The ellipse represents 95% confidence intervals (CI).
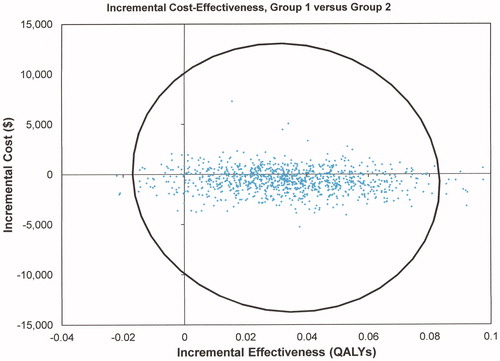
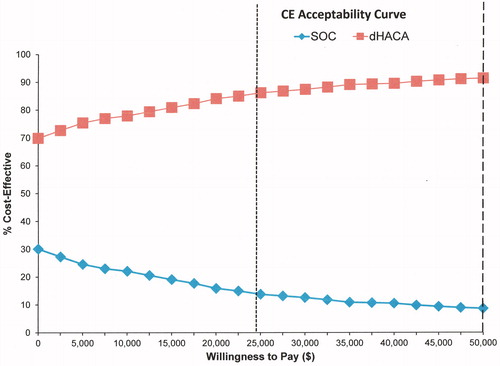
Figure 4. Willingness to pay curve with cost/QALY thresholds: £20,000/QALY based on June 2020 exchange rates (dotted vertical line) and $50,000/QALY (dashed line).