Figures & data
Figure 1. An overview of the model structure, used for the cost-effectiveness analysis. Glaucoma was assumed to develop from early state to blindness. In each state categorized by severity of glaucoma, treatment adherence like non-treatment was taken into account, which impacted the progression or blindness rate.
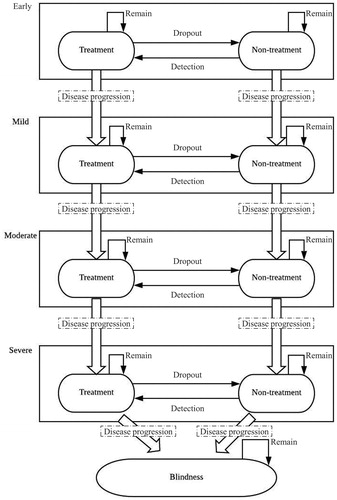
Table 1. Base case values for clinical, quality of life and cost parameters included in the study model.
Table 2. Results of the cost-effectiveness analysis.
Figure 2. Tornado diagram showing one-way sensitivity analysis targeting ICER.
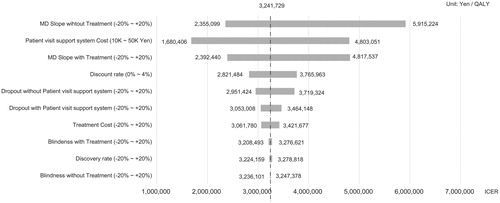
Figure 3. Monte Carlo simulation for probabilistic sensitivity analysis results.
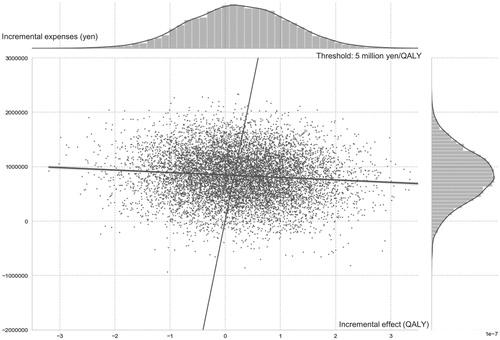
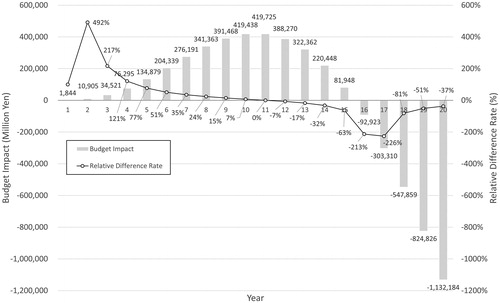
Figure 4. Budget impact analysis results. Budget impact shows cumulative values. Difference rate depicts absolute budgetary difference rate in the particular year compared to the BI of the previous year.