
Figures & data
Figure 1. Patient selection flowchart. Abbreviations. SCD, sickle cell disease; SCT, stem cell transplant.
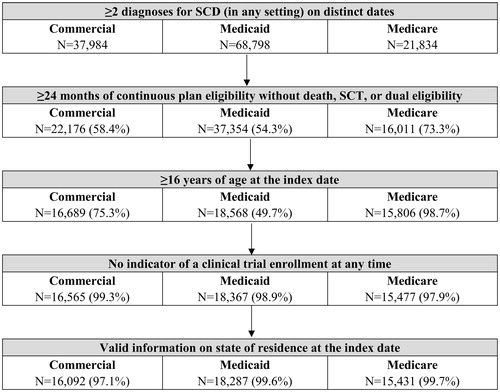
Table 1. Patient baseline characteristics.
Figure 2. Occurrence of SCD-related complications during the 12-month follow-up period.
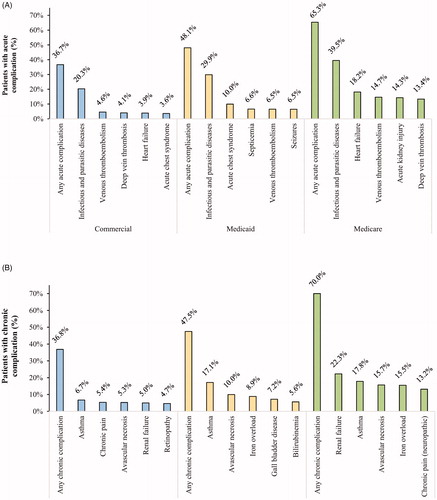
Table 2. Frequency and characteristics of vaso-occlusive crises during the 12-month follow-up period.
Table 3. Annual healthcare resource utilization of patients with SCD stratified by the annual number of VOCs during the 12-month follow-up period.
Figure 3. Mean all-cause healthcare costs and inpatient costs per patient stratified by number of VOCs during the 12-month follow-up period. Abbreviations. SCD, sickle cell disease; USD, United States dollars; VOC, vaso-occlusive crisis.
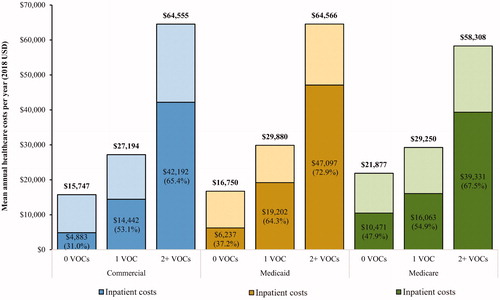
Figure 4. Mean all-cause and SCD-related healthcare costs per patient stratified by number of VOCs during the 12-month follow-up period. Abbreviations. SCD, sickle cell disease; USD, United States dollars; VOC, vaso-occlusive crisis.
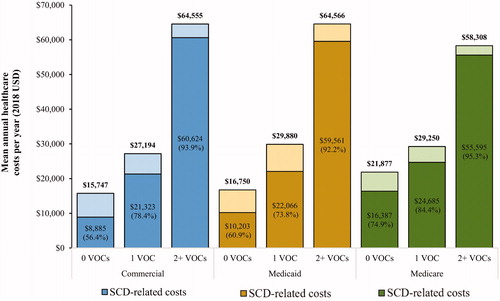
Table 4. Annual healthcare costs of patients with SCD stratified by the annual number of VOCs during the 12-month follow-up period.
Online_Supplement.docx
Download MS Word (21.8 KB)Data availability statement
Data used for this study are from IBM (used under license for the current study) and Centers for Medicare and Medicaid Services (CMS; administrative permissions were required to access the raw data under a data user agreement requesting HIPAA waiver and IRB exemption). Therefore, restrictions apply to the availability of these data, which are not publicly available.