
Figures & data
Figure 1. Cost-effectiveness analysis and cost-utility analysis-based pricing. Abbreviations. CEA, cost-effectiveness analysis; CUA, cost-utility analysis; CEAC, cost-effectiveness acceptability curve; DSP, dimension-specific price.
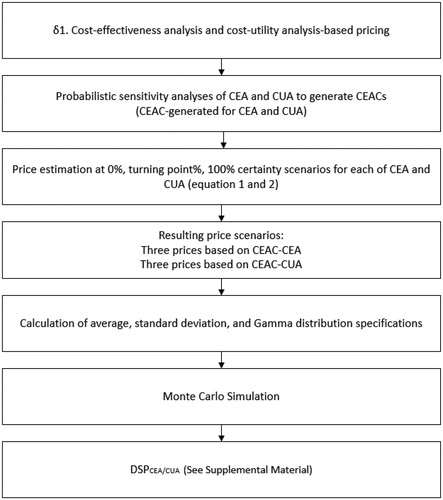
Table 1. Model inputs.
Table 2. Results of cost-effectiveness and cost-utility analyses.
Figure 2. Cost-effectiveness acceptability curves (CEAC). (A) PSA ICER-generated CEAC; (B) PSA ICUR-generated CEAC.
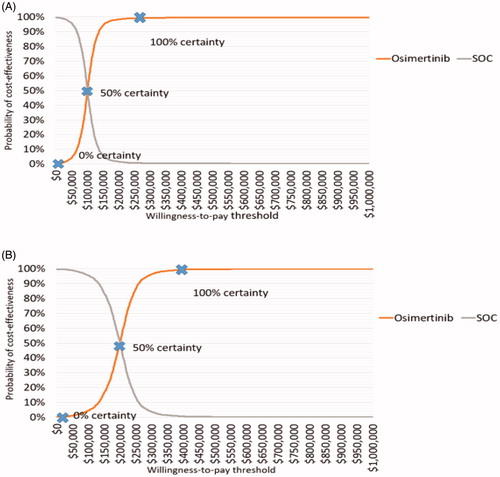
Table 3. Prices of osimertinib suggested per two hypothetical contracts (2019–2020 and 2019–2021).
Supplemental material