
Figures & data
Figure 1. Five-step method for estimating paybacks to support adherence programs. Abbreviations. t, time of contract, RCT, randomized controlled trial, RWD, real-world data; MCS, Monte Carlo Simulation.
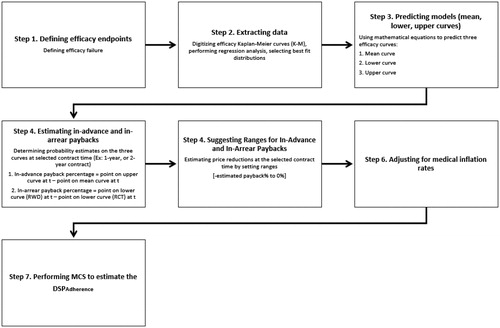
Figure 2. Hypothetical example of a deterministic curve for drug A, with by lower and upper curves.
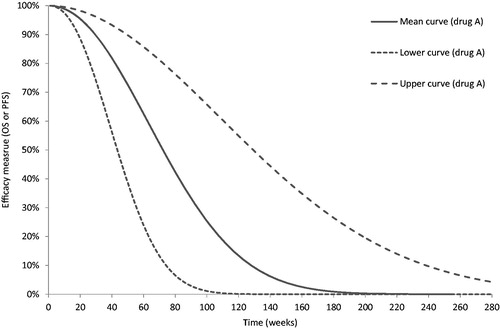
Figure 3. Hypothetical example for estimating efficacy probabilities for 1-year contracting.
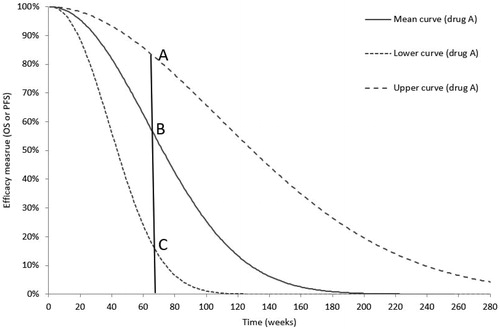
Table 1. Model inputs.
Figure 4. Overall survival (OS) Weibull upper, deterministic, and lower curves.
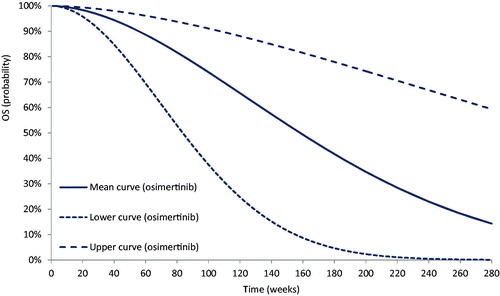
Figure 5. Progression-free survival (PFS) Weibull upper, deterministic, and lower curves.
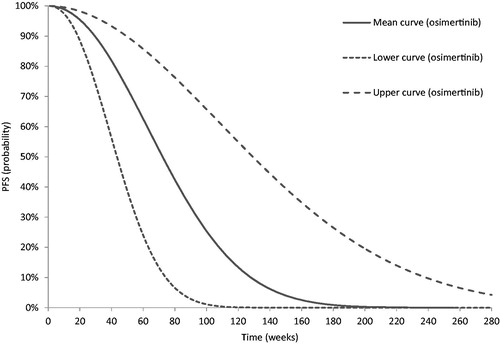
Table 2. Equations used to predict mean, lower, and upper Weibull curves for overall survival (OS).
Table 3. Equations used to predict mean, lower, upper Weibull curves for progression-free survival (PFS).
Table 4. Probability and differential estimates.
Table 5. Adherence-based pricing for 1-year contract (2019–2020) and 2-year contract (2019–2021).