
Figures & data
Table 1. Population and adherence estimates.
Figure 1. Screening mix and adherence.
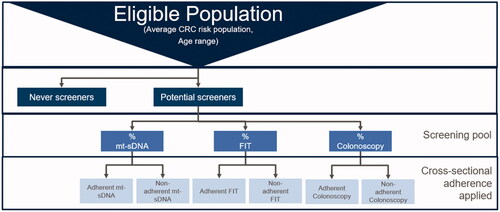
Table 2. Key clinical parameters.
Figure 2. Incremental number of screening events (increased mt-sDNA-status quo), ages 50–75.
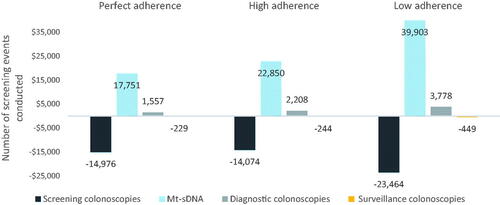
Table 3. Clinical outcomes per adherence scenario, ages 50–75 years.
Figure 3. (a) Cost-savings by adherence scenario, payer perspective. The non-monotonic direction of savings is due to the 100% screening naïve youngest age band of the 45–75-year-old cohort. (b) Cost-savings by adherence scenario, IDN perspective.
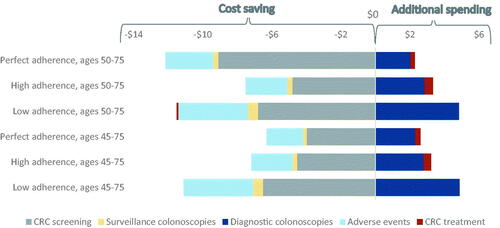
Figure 4. Incremental costs (in millions) per category (increased mt-sDNA-status quo), payer perspective.
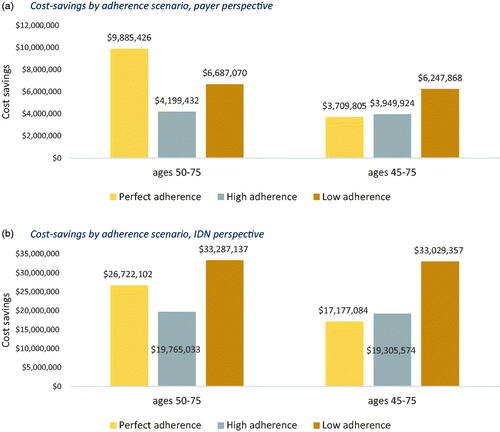
Table 4. Total costs for the IDN perspective, ages 50–75.
Table 5. Total costs for the payer perspective, ages 50–75.