
Figures & data
Figure 1. Model structure.
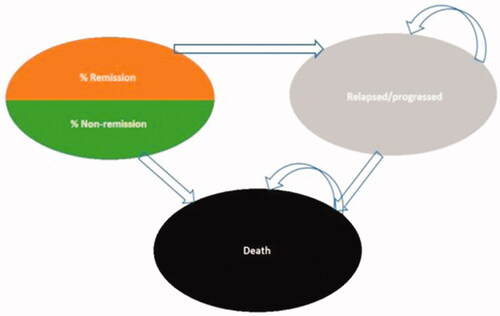
Figure 2. (A) Overall survival curves: main population. (B) Overall survival curves: 20–30% BMB subgroup. (C) Overall survival curves: >30% BMB subgroup. Abbreviations: AZA, azacitidine; BMB, bone marrow blasts; GLAS, glasdegib; KM, Kaplan–Meier; LDAC, low-dose cytarabine.
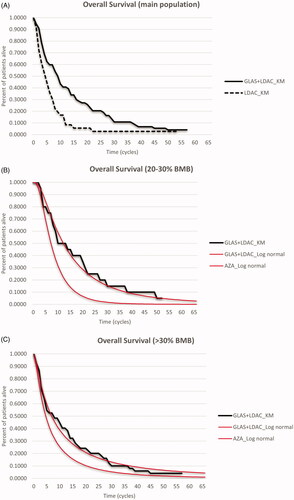
Figure 3. (A) Derived progression-free-survival curves: main population. (B) Derived progression-free-survival curves: 20–30% BMB subgroup. (C) Derived progression-free-survival curves: >30% BMB subgroup. Abbreviations: AZA, azacitidine; BMB, bone marrow blasts; GLAS, glasdegib; KM, Kaplan–Meier; LDAC, low-dose cytarabine; PFS, progression-free survival.
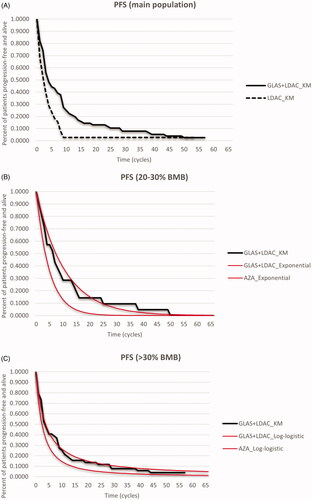
Table 1. OS HRs of glasdegib + LDAC versus azacitidine obtained from a previous publicationCitation12.
Table 2. Derived remission and non-remission rates.
Table 3. Median treatment durations.
Table 4. Health-state utility values.
Table 5. Costs inputs.
Figure 4. (A) Probabilistic analysis results presented on the cost-effectiveness plane: main population. (B) Probabilistic analysis results presented on the cost-effectiveness plane: 20–30% BMB. (C) Probabilistic analysis results presented on the cost-effectiveness plane: >30% BMB. Abbreviations: BMB, bone marrow blasts; LDAC, low-dose cytarabine; QALY, quality-adjusted life-year.
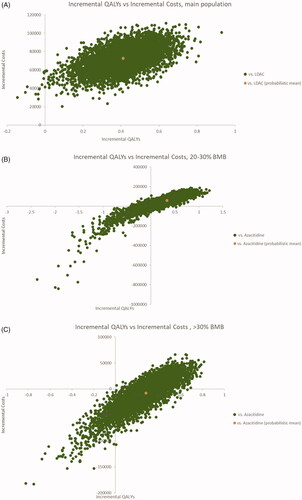
Figure 5. (A) Cost-effectiveness acceptability curve: main population. (B) Cost-effectiveness acceptability curve: 20–30% BMB. (C) Cost-effectiveness acceptability curve: >30% BMB. Abbreviations: BMB, bone marrow blasts; LDAC, low-dose cytarabine.
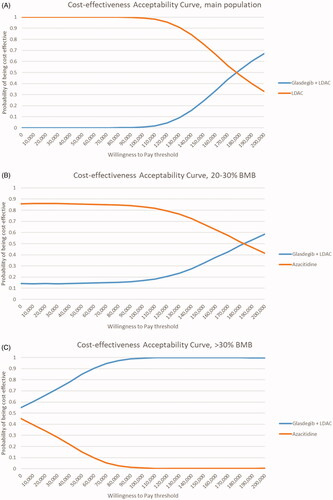
Table 6. Probabilistic cost-effectiveness results.