
Figures & data
Table 1. Baseline demographic and clinical characteristics among TNFi-experienced and tDMARD naïve patient cohorts.
Figure 1. TNFi-experienced patient cohort: distribution of percent patients with infection-related hospital visits at baseline and follow-up by infection type. *indicate values were significant at <0.0001 level of significance. Note: The infection sites were not mutually exclusive. Patients may have experienced more than one type of infection during the hospital stay. Patients with multiple infections during follow-up were counted only once for the estimation of the total percent.
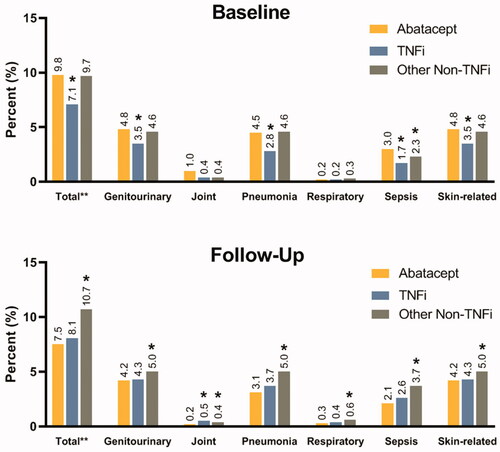
Table 2. Infection-related hospital visits at baseline and follow-up among TNFi-experienced and tDMARD naïve patient cohorts.
Figure 2. tDMARD naïve patient cohort: distribution of percent patients with infection-related hospital visits at baseline and follow-up by infection type. *indicate values were significant at <0.0001 level of significance. Note: The infection sites were not mutually exclusive. Patients may have experienced more than one type of infection during the hospital stay. Patients with multiple infections during follow-up were counted only once for the estimation of the total percent.
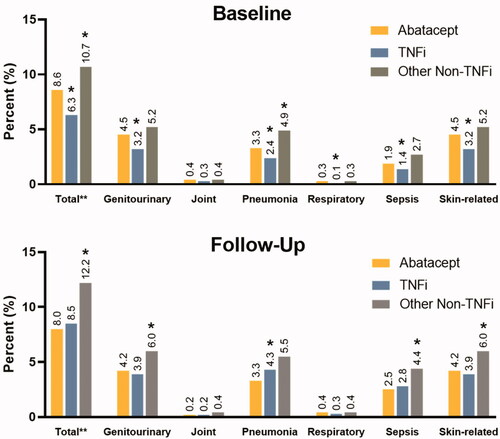
Table 3. Comparison of infection-related hospitalization costs by tDMARD therapies among TNFi-experienced and tDMARD naïve patient cohorts.
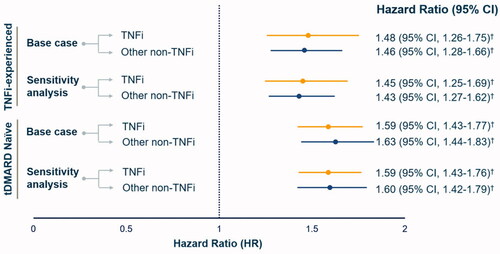
Figure 3. Comparison of adjusted infection-related hospitalization risk by tDMARD therapies among TNFi-experienced and tDMARD naïve patient cohorts. Note: HR were estimated by comparing TNFi and other non-TNFi to abatacept users i.e abatacept group served as a reference. † indicate values were significant at <0.0001 level of significance.
Supplemental Material
Download PDF (48.7 KB)Data availability statement
The data described in this paper are sourced from CMS Medicare Fee-for-Service claims and enrollment data. The analytic file constructed for this analysis cannot be shared due to protections of patient privacy. Researchers may request use of CMS data through ResDAC.