Figures & data
Figure 1. Rapid Response EEG System. Rapid-EEG is a new EEG device developed by Ceribell, Inc. (Mountain View, CA) and cleared by US Food and Drug Administration (FDA) since 2018. It consists of a headband with 10 electrodes (5 left and 5 right), which enables eight-channel EEG acquisition with a pocket-size battery-operated EEG recording device. The EEG can be set up by anyone without needing specialized EEG techs. The acquired data is accessible at the bedside as well as on a cloud portal that can be accessed remotely in real time.
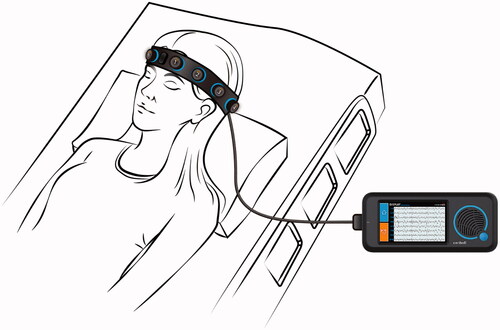
Table 1. DECIDE trial summary.
Figure 2. Decision tree model for cost–benefit analysis. Two-armed decision model with intervention (Rapid-EEG vs clinical suspicion only) at the point of suspected seizure and subsequent event nodes corresponding with diagnostic categories of Rapid-EEG interpretation (true positive, false positive, true negative, false negative). Length of stay data at terminal nodes correspond to Nationwide Inpatient Sample 2017 cross-sectional cohorts for coma (ICD10 codes R40.2*), seizure (Clinical Classification Software diagnostic grouper CCS-83), and mechanical ventilation (ICD10 procedure = 5A1935Z, 5A1945Z, 5A1955Z). Abbreviations. EEG, electroencephalography; FN, false negative; FP, false positive; NCSz, non-convulsive seizure; NIS, National Inpatient Sample; TN, true negative; TP, true positive.
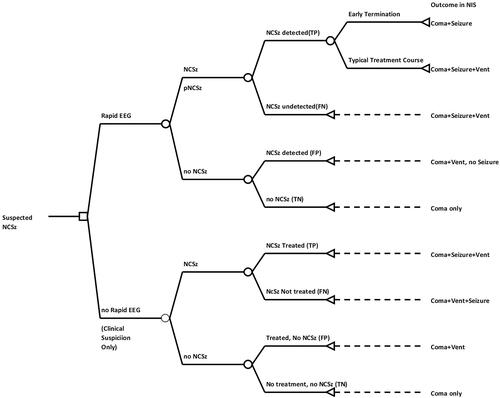
Table 2. Model input parameters.
Table 3. Results of reference case and probabilistic sensitivity analysis (PSA).
Figure 3. Monte Carlo simulation. This figure depicts results of Monte Carlo simulation with 1,000 replications of difference in costs between Rapid-EEG and clinical suspicion.
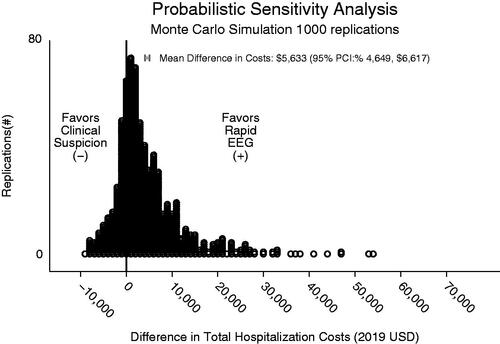
Figure 4. ANCOVA sum of squares analysis. Depicts contribution of model input parameters to variation in the difference in total cost between decisions based on Rapid-EEG vs. clinical suspicion.
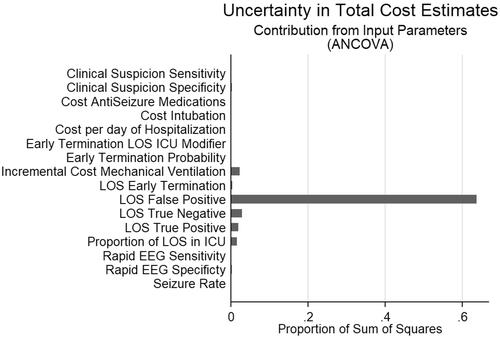
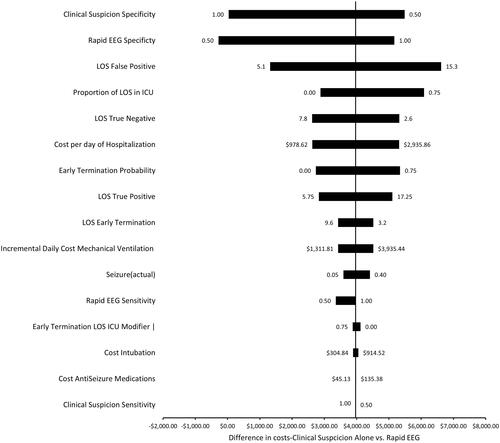
Figure 5. One way factor analysis: tornado plot depicting the effect of varying model inputs along a range of values on the difference in costs between Rapid EEG and clinical suspicion for NCSE.