
Figures & data
Table 1. Challenges in evaluating digital care management.
Table 2. General framework for evaluating digital care management for multimorbid populations.
Figure 1. Illustrative example of the randomized propensity matching technique.
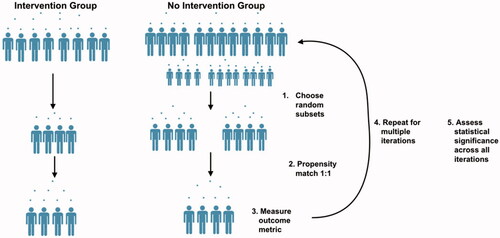
Figure 2. Distribution of multi-morbidity of chronic conditions across the population. Of the Intervention population, 82% of individuals had two or more chronic conditions and 84% of the Control population had two or more chronic conditions. Note that this is the distribution prior to matching. shows distributions over specific chronic conditions for three sample matching iterations. Mental health diagnosis includes depression and anxiety disorders.
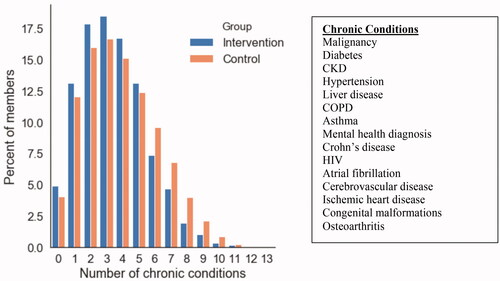
Figure 3. Relationship between number of comorbid chronic conditions and the number of inpatient visits in the year prior to intervention (A), number of ER visits (B), number of outpatient non-preventive visits (C), and number of preventive outpatient visits (D) in the combined Intervention and Control populations, prior to matching.
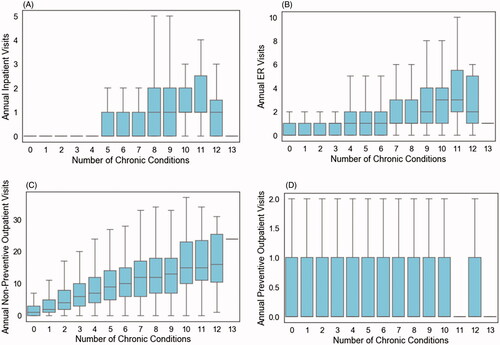
Table 3. Population demographics and utilization patterns at baseline and after three random matching iterations.
Figure 4. Left: distribution of match rate across all 100 randomized bootstrap iterations in the intervention population. Right: distribution of match rate across all 100 randomized iterations in the control population.
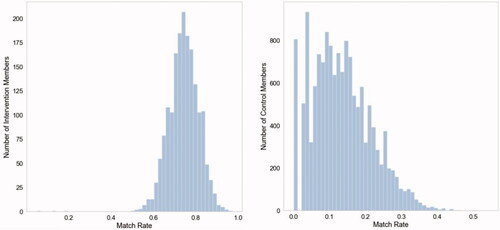
Figure 5. Distributions of outcomes in each group over 100 randomized iterations for (A) ER Visits per 1,000 members, (B) preventive medicine visits per 1,000 members, (C) non-preventive outpatient visits per 1,000 members, (D) inpatient visits per 1,000 members, over the 3 months following the initiation of the digital health platform intervention or the beginning of eligibility for the platform in the control population.
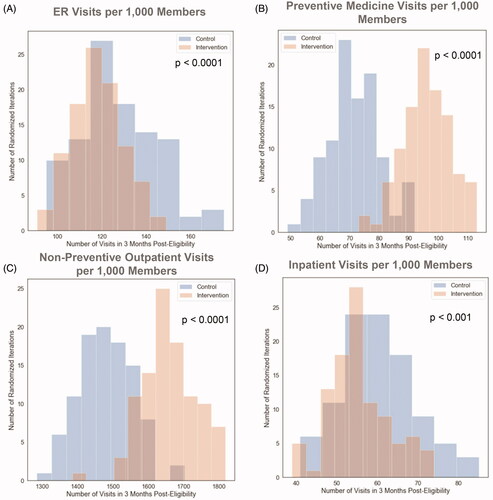
Table 4. Utilization outcomes.
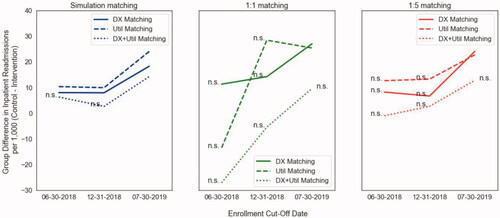
Figure 6. Left: Inpatient utilization results of our propensity with bootstrapping methodology using three different matching criteria across three dates and sample sizes. Center: results using standard 1:1 propensity matching. Right: results using 1:5 propensity matching. (n.s. = not significant group difference at p < .05).
Data availability statement
The data that support the findings of this study are available from a Wellframe health plan customer, but restrictions apply to the availability of these data, which were used under license for the current study, and so are not publicly available. Data are however available from the authors upon reasonable request and with permission of the health plan in question.