
Figures & data
Figure 1. Study design.
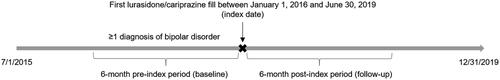
Table 1. Baseline demographics and clinical characteristics for patients in the lurasidone cohort and cariprazine cohort.
Table 2. All-cause and psychiatric-related healthcare resource utilization, unadjusted and adjusted difference-in-difference.
Figure 2. Patient selection.
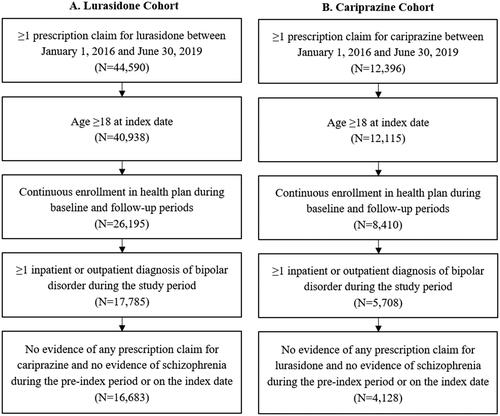
Figure 3. Proportion of patients with all-cause and psychiatric-related hospitalizations. Notes: ***Indicates significance at p<.001.
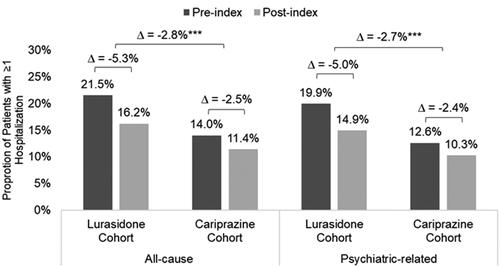
Table 3. All-cause and psychiatric-related healthcare costs, unadjusted and adjusted difference-in-difference.
Figure 4. Adjusted Kaplan Meier curve for time to discontinuation. Notes: Covariates in the model included age, sex, geographic region, payer type, bipolar disorder type, comorbidities, atypical antipsychotic use, number of patients with inpatient hospitalizations, number of patients with ER visits, and total costs during the 6-month baseline period.
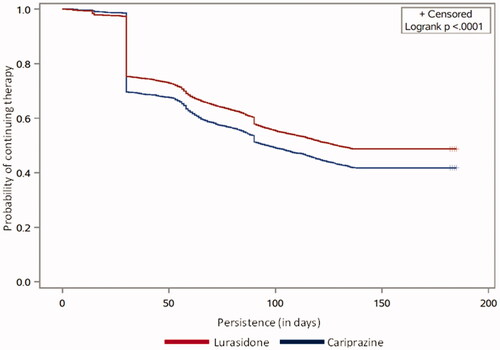
Table 4. Lurasidone and cariprazine treatment patterns during 6-month post-index period.