Figures & data
Figure 1. Hypothyroidism cohort: inclusion/exclusion criteria and sample size.
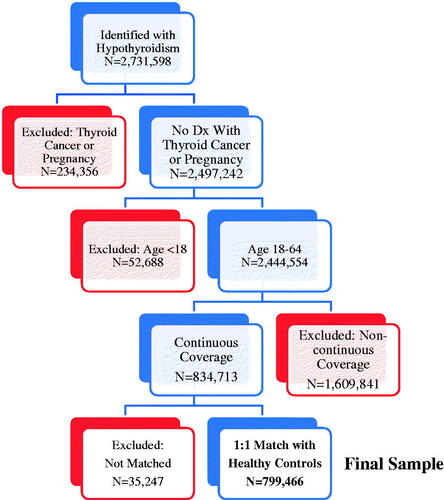
Table 1. Descriptive statistics pre- and post-matching.
Table 2. Hypothyroidism-related costs per person per year in US dollars.
Figure 2. Estimated direct medical costs. *Differences are statistically significant (p < 0.0001). Average cost of levothyroxine = $236/year. Results from multivariable analyses that controlled for age, sex, region of residence, insurance type, and general health.
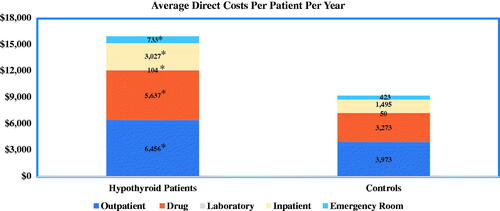
Figure 3. Estimated all-cause health resource utilization. *Differences are statistically significant (p < 0.0001). Results from multivariable analyses that controlled for age, sex, region of residence, insurance type, and general health. OR, odds ratios. 95% confidence intervals given in parentheses. aHypothyroid patients, n = 70,236; Controls, n = 40,399.
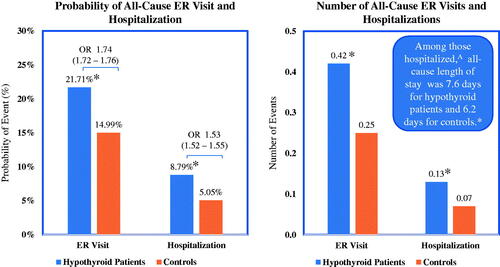
Figure 4. Estimated probability of comorbidity. All differences are statistically significant (p < 0.0001). Results from multivariable analyses that controlled for age, sex, region of residence, insurance type, and general health. Odds ratios (ORs) and 95% confidence intervals (in parentheses) presented above estimated probabilities. Abbreviations. AD, Addison’s disease; BD, bipolar disorder; CD, celiac disease; DP, depression; HT, hypertension; MG, myasthenia gravis; MH, migraine headache; OB, obesity; PA, pernicious anemia; RA, rheumatoid arthritis; SCZ, schizophrenia; T1D, type 1 diabetes; T2D, type 2 diabetes.
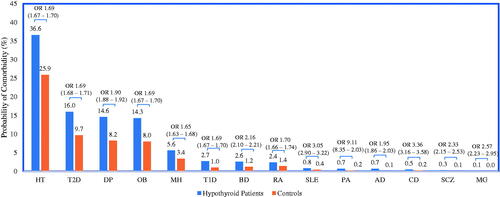
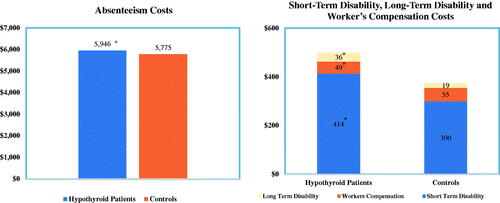
Figure 5. Estimated productivity costs. Sample sizes: Absenteeism, n = 17,830; STD, n = 151,762; LTD, n = 128,564; WC, n = 70,020. *Difference are statistically significant (p < 0.005). Results from multivariable analyses that controlled for age, sex, region of residence, insurance type, and general health.