
Figures & data
Figure 1. Tornado diagram for squamous (a) and non-squamous (b) NSCLC in Canada. Lower and upper limits of the OWSA shown in parentheses; all costs shown in CAN$. Abbreviations. ICER, incremental cost-effectiveness ratio; PF, progression-free; PD, progressed disease.
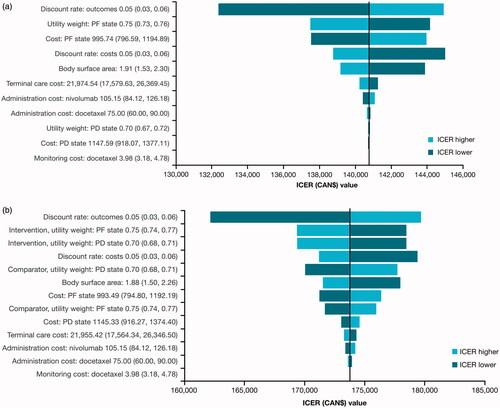
Table 1. Cost and utility inputs in the models.
Table 2. Base-case results for the squamous (a) and non-squamous (b) NSCLC populations in Canada (CAN$).
Table 3. Base-case results for the squamous (a) and non-squamous (b) NSCLC populations in Sweden (SEK).
Figure 2. CEAC for squamous (a) and non-squamous (b) NSCLC in Canada. Abbreviations. CEAC, cost-effectiveness acceptability curve; QALY, quality-adjusted life-year; WTP, willingness to pay.
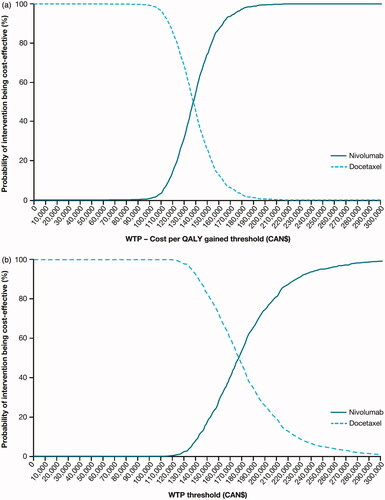
Figure 3. Tornado diagram for squamous (a) and non-squamous (b) NSCLC in Sweden. Lower and upper limits of the OWSA shown in parentheses; all costs shown in SEK. Abbreviations. ICER, incremental cost-effectiveness ratio; PF, progression-free; PD, progressed disease.
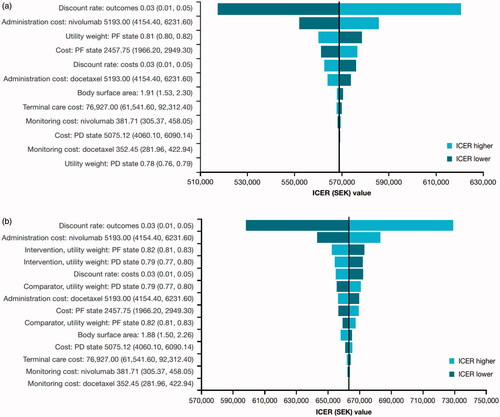
Figure 4. CEAC for squamous (a) and non-squamous (b) NSCLC in Sweden. Abbreviations. CEAC, cost-effectiveness acceptability curve; QALY, quality-adjusted life-year; WTP, willingness to pay.
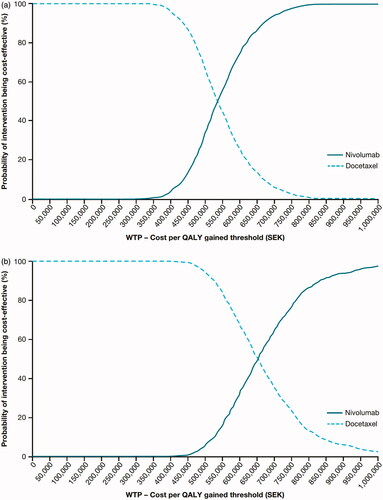
Table 4. Scenario analyses results for the squamous (a) and non-squamous (b) NSCLC populations in Canada (CAN$).
Table 5. Scenario analyses results for the squamous (a) and non-squamous (b) NSCLC populations in Sweden (SEK).
Supplemental Material
Download MS Word (137.9 KB)Data availability statement
The analysis reported in this study uses patient-level data from the CheckMate 017 and CheckMate 057 trial. The patient-level data are not publicly available, but the results of the trial have been reported in a number of publications. The trial results supporting the findings of this analysis are presented graphically within the article. The survival analysis was implemented in R using the flexsurv package.